Figure 2.
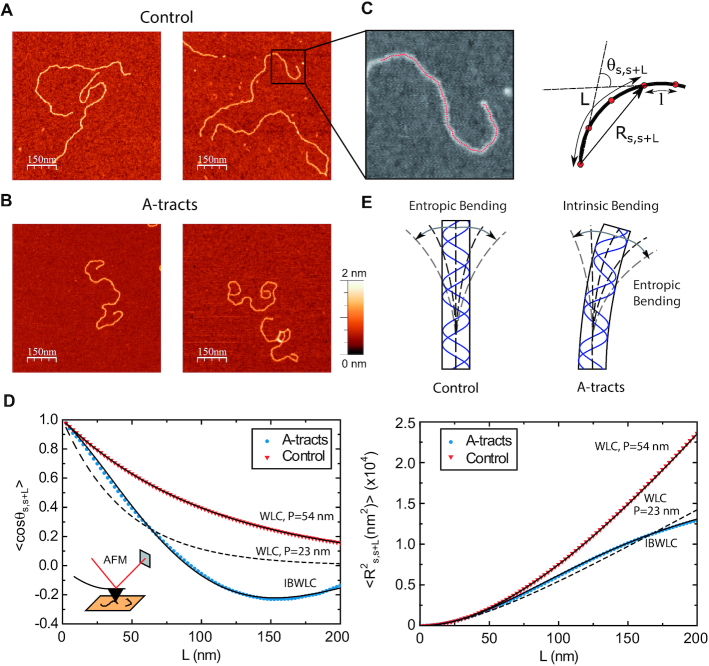
Mechanical properties of A-tracts at zero force. Representative AFM images taken in air of (A) control and (B) A-tract DNA molecules adsorbed on a mica surface using Mg2+ ions. (C) Detailed view of an individual DNA molecule. A series of dots (in red) separated by 2.5 nm were used to define the contour of the DNA molecules. Right, schematic representation of the measured quantities showing the angles between the tangents,  , and the distance,
  , for two points separated by a contour distance of l = 7.5 nm. (D) The quantities
  and
and  , were averaged over all the traces. The resulting
  and
and  are plotted as a function of the contour distance separation between points,
  .
.  values of control and A-tract molecules were fitted to the WLC and IBWLC using Equations (2) and (5), respectively. This yielded a value of P = 54 ± 1 nm for control DNA and P = 55 ± 1 nm, a = 17 ± 1 μm−1 for the A-tract molecule. Solid lines in the
  plot are not fits but the representation of Equations 3 and 6 (WLC and IBWLC, respectively) using the fitting parameters obtained from the
  plot. Dashed lines represent best fits of the A-tracts data to the WLC model with P = 23 ± 1 nm. (E) Schematic representation of the WLC and IBWLC models. In the WLC model, the minimum energy corresponds to a straight conformation (zero intrinsic curvature; dashed black line) but the molecule can be entropically bent (dashed grey lines) as a result of its bending flexibility. In the IBWLC model, the molecule has both intrinsic curvature (curved dashed black line) and entropic bending (grey dashed line).

