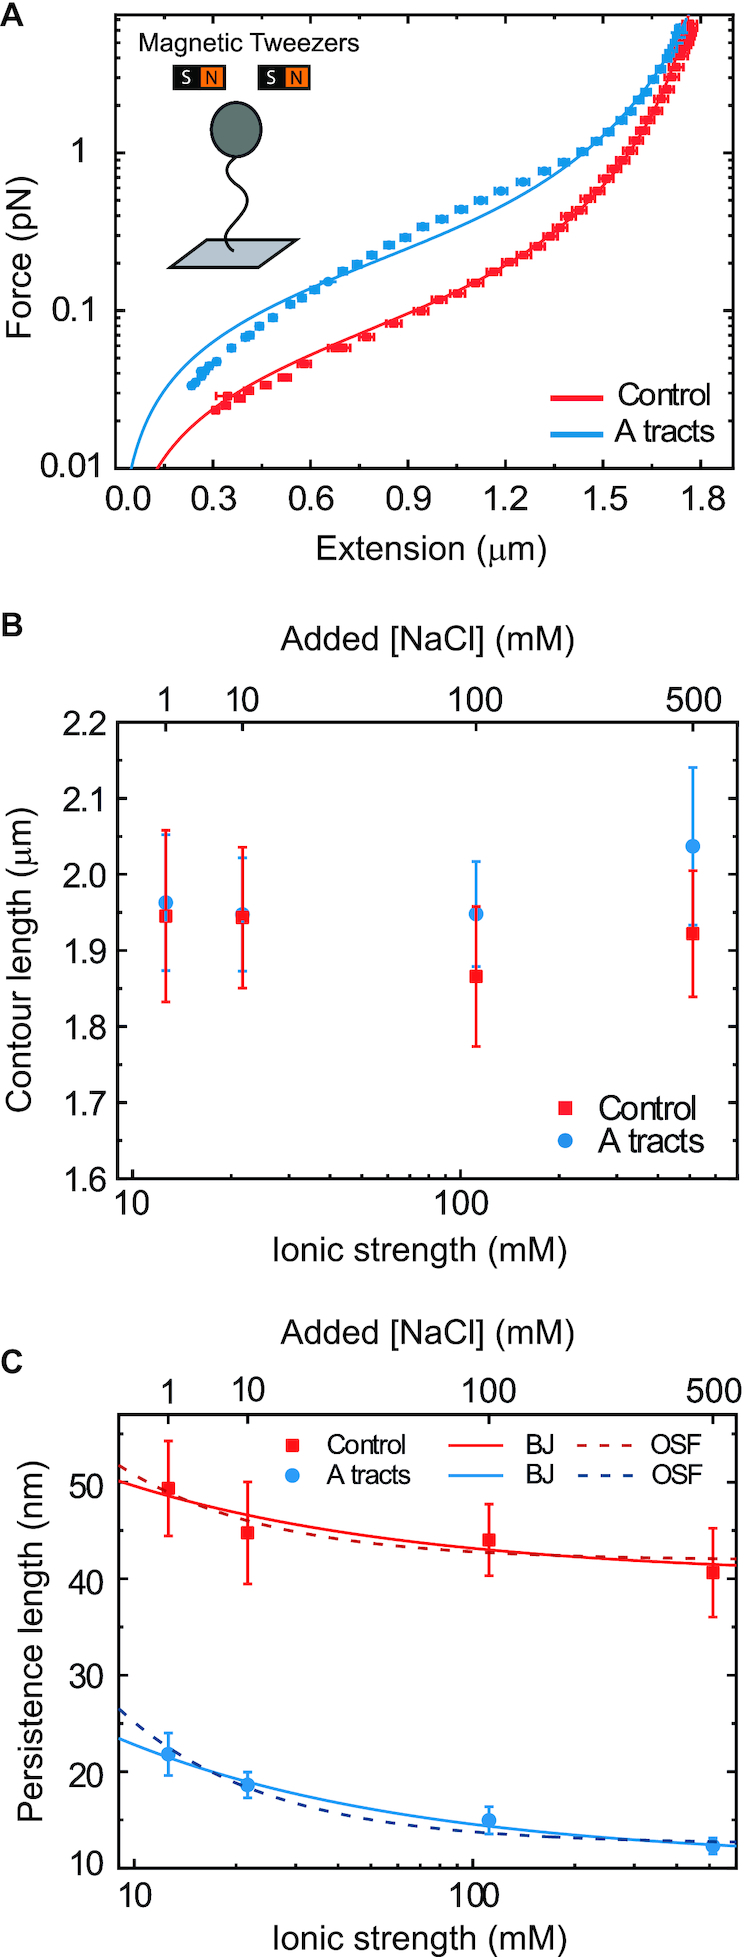
Figure 3.

Mechanical response of A-tracts to forces below 10 pN. (A) Average force-extension curves of A-tracts and control DNA molecules obtained with magnetic tweezers (100 mM NaCl, mean ± s.e.m., N = 20 for the control and N = 28 for the A-tracts). Solid lines are fits to the WLC formula accounting for low force corrections (Equation (7)). (B) Contour length values (mean ± sd) obtained from the fits of the force-extension curves of control (red) and A-tracts (blue) molecules to Equation (7) at different ionic strength conditions. (C) Relation between the persistence length  and the ionic strength (mean ± sd). The lower errors for A-tracts are the result of the larger difference between force-extension curves at low persistence lengths and at low forces. The data was fit to the Barrat and Joanny (BJ) model and to the Odjik–Skolnick–Fixman (OSF). Fitting to the BJ model yielded
  = 40 ± 1 nm,
  = 30 ± 9 nm·mM1/2 for control molecules and
  = 11 ± 1 nm,
  = 38 ± 3 nm·mM1/2 for A-tracts. Fitting to the OSF model yielded
  = 42 ± 1 nm,
  = 89 ± 28 nm·mM for control molecules and
  = 13 ± 1 nm,
  = 126 ± 20 nm·mM for A-tracts. Other models such as the OSF model with fixed
  and the Netz–Orland model did not properly describe our data (not shown).
