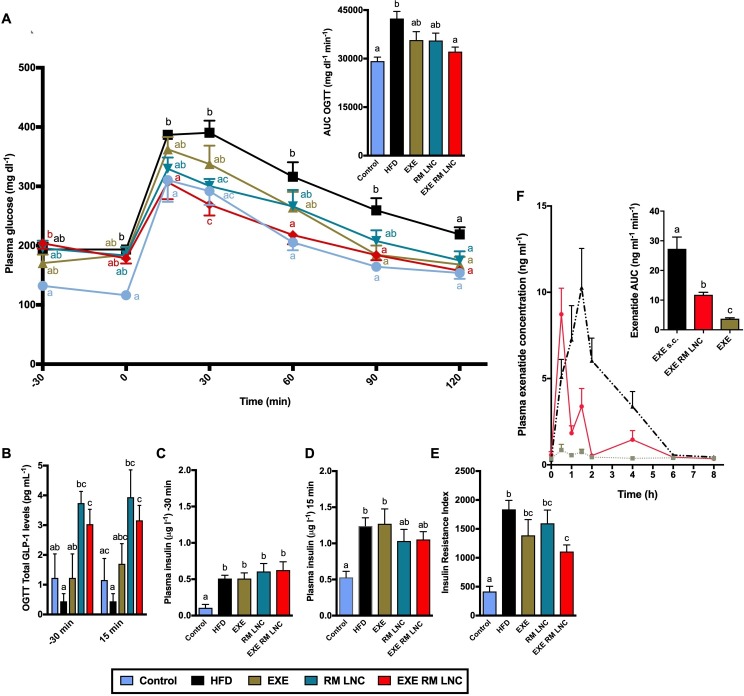
Figure 2.
Pharmacodynamic and pharmacokinetic evaluation of EXE-RM-LNC in a high-fat diet (HFD)-induced obese/diabetic mouse model following acute treatment. (A) Plasma glucose levels (mg dL-1) measured 30 min before and 120 after glucose challenge (n=8–9) and mean area under the curve (AUC, mg dL-1 min-1) measured 30 min before and 120 after glucose challenge (n=8–9). (B) Plasma total glucagon-like peptide-1 (GLP-1) levels and (C, D) plasma insulin levels measured 30 min before and 15 min after glucose challenge (n=8–10). (E) Insulin resistance index (n=8–9). (F) Concentration-time profile and AUC of exenatide after subcutaneous administration (EXE s.c.) (50 µg/kg exenatide dose) and oral administration, in solution and within RM-LNC (EXE and EXE-RM-LNC, respectively) (500 µg/kg exenatide dose). Data are presented as the mean±SEM (n=8–10). Data with different superscript letters (A, B) are significantly different (p<0.05) according to a two-way analysis of variance (ANOVA) followed by Tukey’s post hoc test or (C–F) according to a one-way ANOVA followed by Tukey’s post hoc test.

