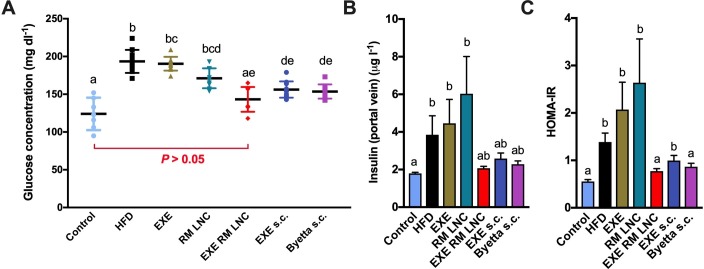
Figure 3.
Effect of EXE-RM-LNC on glucose homeostasis and hyperinsulinemia in obese/diabetic mice. (A) Plasma glucose levels (mg dL-1) after 5 weeks of treatment (13 weeks of high-fat diet (HFD) feeding). Data are presented as the mean±SEM (n=10). (B) Insulin plasma levels measured from the portal vein (n=8–10). Data are presented as the mean±SEM data with different superscript letters are significantly different (p<0.05). (C) HOMA-IR was calculated using the equation [fasting glucose (mg/dL) × fasting insulin (ng/mL)]/405 as previously described.27 Data are presented as the mean±SEM (n=8–10). P values in (A) were determined by a two-way analysis of variance followed by Tukey’s post hoc test. P values in (B, C) were determined by Kruskal-Wallis followed by Dunn’s post hoc test.

