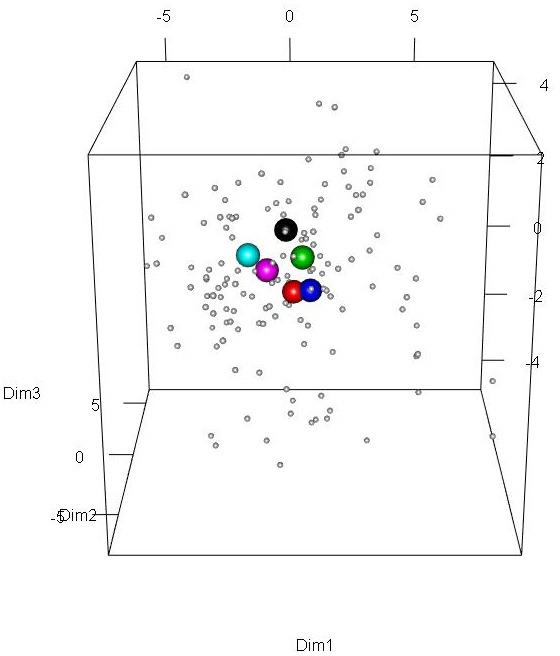
Figure 3.

Scaled principal component analysis plot of faecal samples from the superdonor and patients before transplantation. The patient samples are indicated by small grey circles. The superdonor samples are indicated by the larger circles of different colours that indicate the sampling times: Black, 3 months; red, 6 months; green, 9 months; blue, 12 months; light blue, 15 months; and pink, 18 months. All of the superdonor samples are grouped closely together and remain in very similar positions over time.
