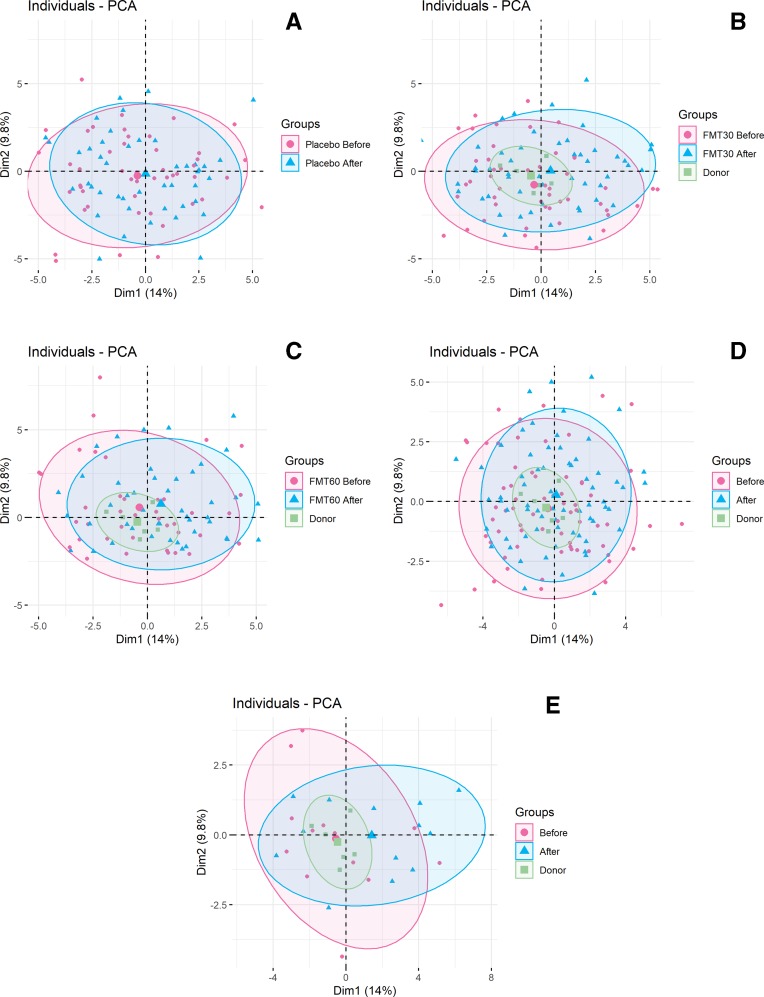
Figure 5.
Scaled PCA plot of faecal samples before and after transplantation for placebo (A), 30 g FMT (B), 60 g FMT (C), responders (D) and non-responders (E). Faecal samples before and after transplantation are indicated by pink circles and blue triangles, respectively. The ellipses cover 80% of the samples within a group. FMT, faecal microbiota transplantation; PCA, principal component analysis.

