
Figure 2.
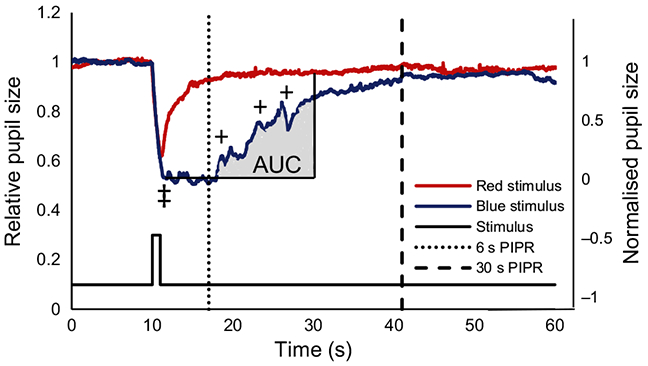
Pupil diameter of the right eye during a 1 s long wavelength stimulus (red trace) presented to the left eye, overlaid with the pupil diameter during a 1 s short wavelength stimulus (blue trace) for one representative subject. ‡ indicates the maximum pupil constriction, dotted and dashed lines show where the 6 s and 30 s PIPR (post illumination pupil response) are measured, + indicates the melanopsin oscillatory responses. The area under the curve (AUC) for the blue stimulus is shaded grey, and is calculated with respect to the normalised pupil size.