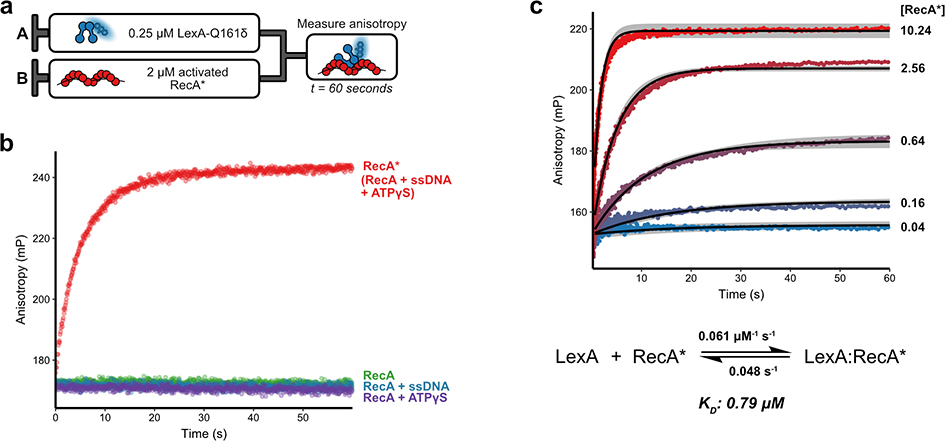
Figure 2.
Association kinetics of labeled LexA with RecA. a) Experimental design of association of LexA with RecA. The indicated amount of Acd-labeled LexA-S119A-Q161δ (LexAδ), is rapidly mixed in a stopped-flow apparatus with post-activation reaction mixtures of RecA and fluorescence anisotropy is measured. b) Plots of anisotropy versus time demonstrate the specificity of LexAδ for RecA*. 250 nM of LexAδ were rapidly mixed with 2 μM of RecA reactions containing only RecA (green), RecA + ATPγS (purple), RecA + ssDNA (blue), or RecA + ATPγS + ssDNA (RecA*, red). Data were fit to a smoothing function (solid lines). c) A series of plots of anisotropy versus time shows the dependence of LexA-RecA* association rate on RecA* concentration. Curve labels indicate the concentration of RecA* (μM) that was mixed with 250 nM of LexAδ. The best-fit curves from reaction simulations after globally fitting three independent concentration series experiments are shown as solid black lines for each concentration. Simulation boundaries at a Chi2 ratio of 0.70 are shown as gray ribbons.

