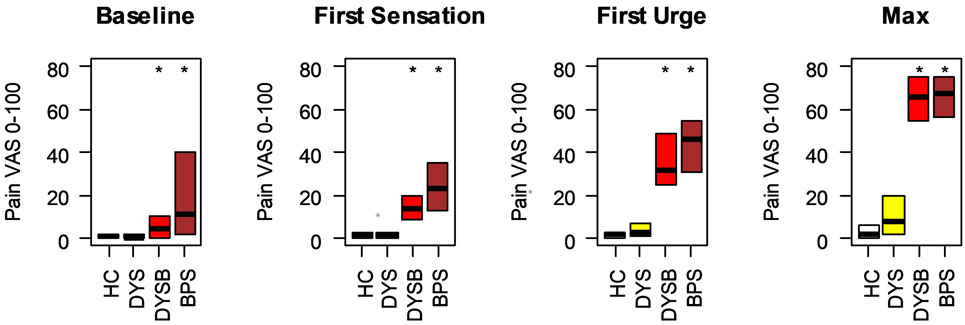
Figure 2: Participants with dysmenorrhea and bladder pain hypersensitivity report pain comparable to participants with bladder pain syndrome.
Participants in each of the 4 groups rated their bladder pain across cystometric thresholds. Box plots indicate median, 25 th and 75th percentile. * indicates worse compared to healthy controls (p < 0.05). HC: Healthy Control, DYS: Dysmenorrhea only, DYSB: DYS + Bladder pain sensitivity, BPS: Bladder Pain Syndrome, VAS: Visual Analogue Scale.

