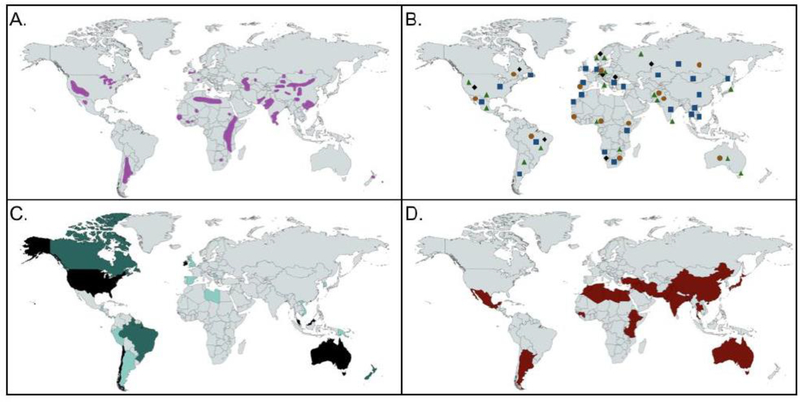
Figure 1:
Global distribution of fluoride. Shown here are areas with (A) <1.5 ppm fluoride in the groundwater (purple), (B) mining of fluoro-compounds (blue squares -fluorspar, brown circles – fluorapatite, green triangles - topaz, and black diamonds - cryolite), (C) percent of the population given government-regulated fluoridated water (light teal – 0–33%, teal – 34–67%, black – 68–100% of population), and (D) endemic fluoride toxicity (red) [Unicef 1999, WHO 2004, Gupta and Ayoob 2016, British Geological Survey, and the USGS Database].

