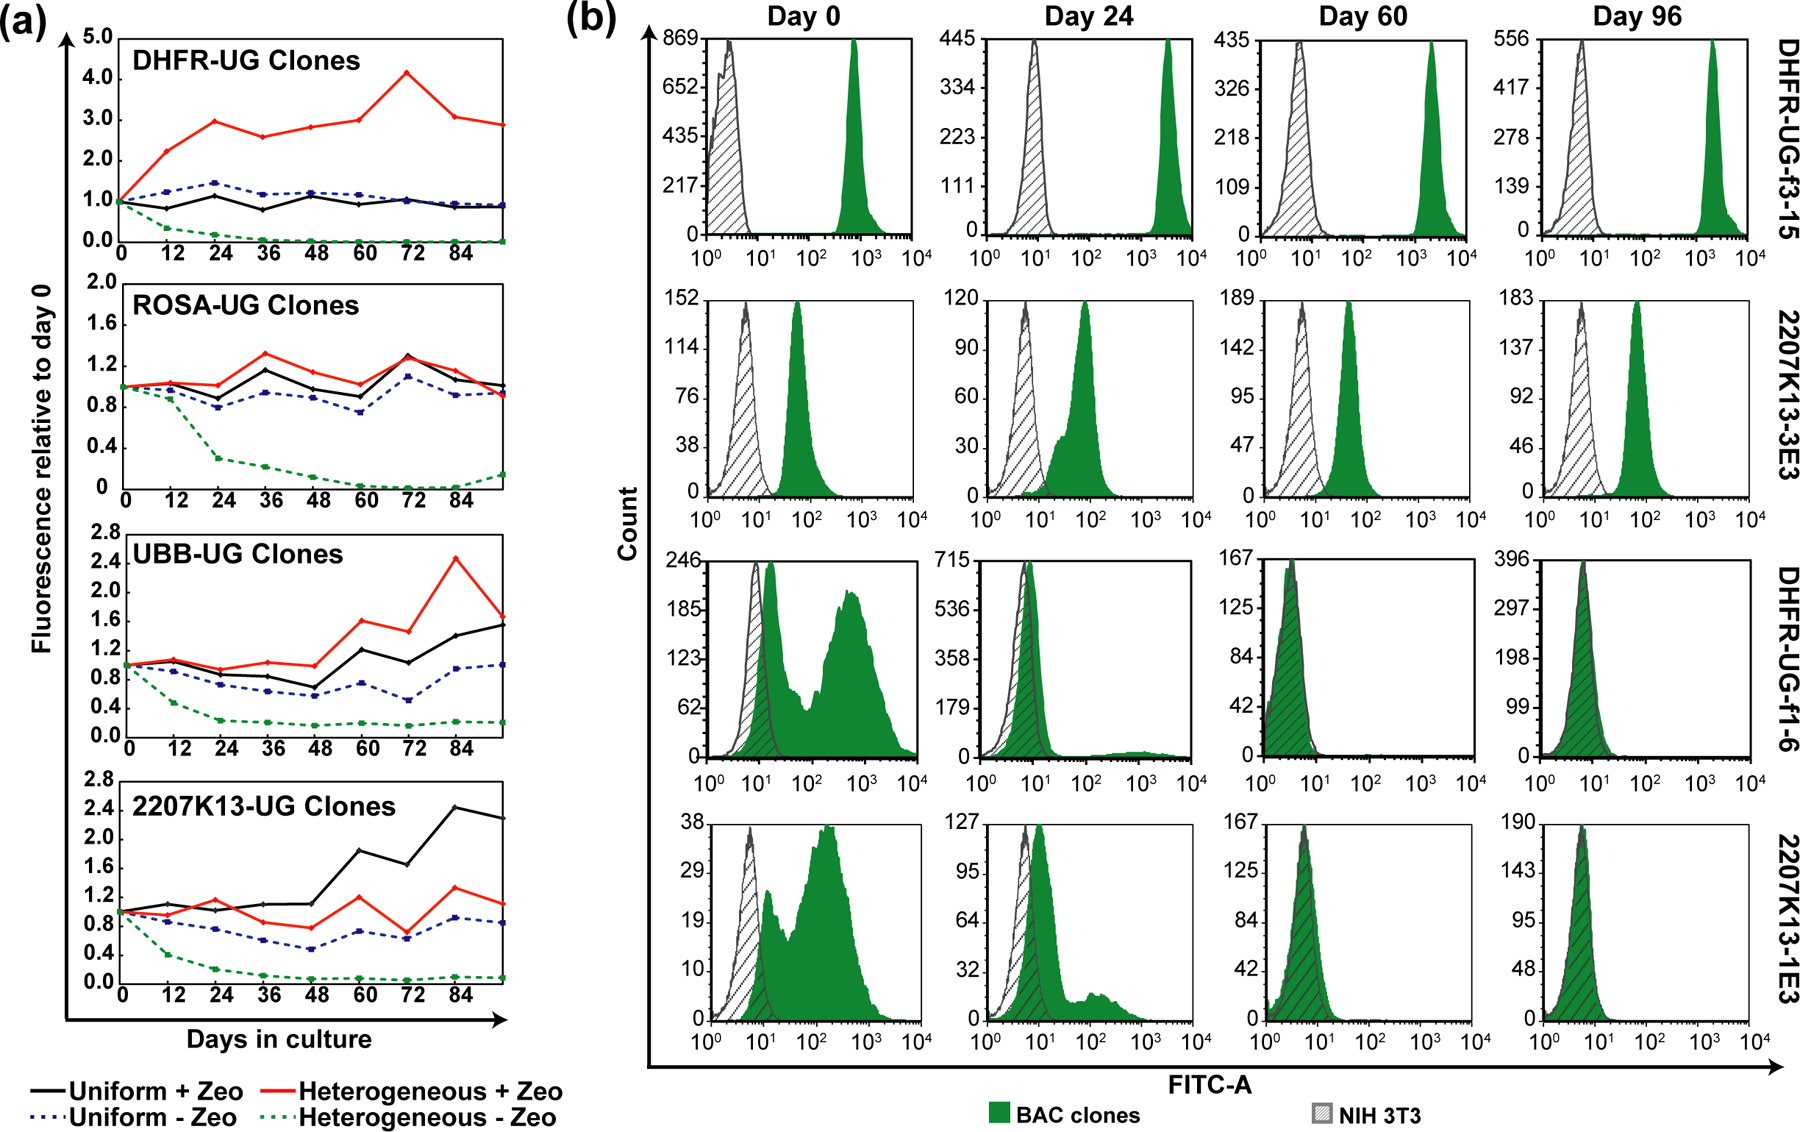
Figure 4. UBC-GFP-ZeoR reporter gene expression over time.

“Uniform” clones show stable expression with or without selection, while “heterogenous” clones show progressive loss of expression without selection. (a) Changes in GFP fluorescence of uniform versus heterogeneous clones, averaged over multiple clones (2–8), carrying indicated BAC transgenes during 96 days of continuous passaging with or without Zeocin selection. x-axis- number of days since removal of Zeocin; y-axis- mean fluorescence values of multiple clones divided by that at day zero; black- “uniform” expressing clones cultured with Zeocin; blue- “uniform” expressing clones cultured without Zeocin; red“heterogeneous” expressing clones cultured with Zeocin; green“heterogeneous” expressing clones cultured without Zeocin; (b) GFP fluorescence histogram of representative “uniform” and “heterogeneous” expressing NIH 3T3 clones at day 0, 24, 60 and 96 without selection. Gray- autofluorescence of untransfected cells; Green- GFP fluorescence of the indicated clones. x-axis- fluorescence; y-axis- cell number.
