Fig. 1.
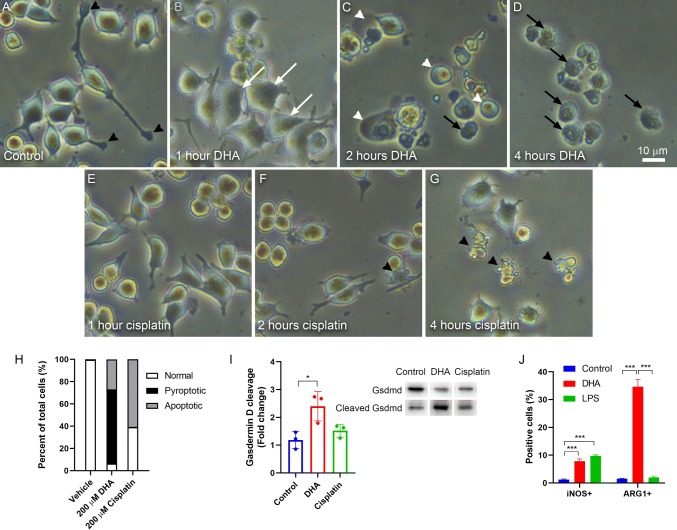
DHA activates morphological and molecular characteristics of pyroptosis. a–d Phase-contrast photomicrographs showing BV-2 microglial cells treated with 200 μM DHA. a Untreated cells appear normal with extended processes and active filopodial tips (black arrowheads). b By 1 h after DHA treatment, cells are larger with shorter processes and apparent swelling of the cell bodies (white arrows). c At 2 h after DHA treatment, cell processes are absent. Many cells have a balloon-like appearance (white arrowheads), while others appear collapsed with irregular boundaries (black arrows). d By 4 h after DHA treatment, nearly all cells appear collapsed. e–g Phase-contrast photomicrographs showing BV-2 microglial cells treated with 200 μM cisplatin. e At 1 h after cisplatin treatment, cells are largely unchanged. f After 2 h of cisplatin treatment, there is some loss of cellular processes and increased cell rounding. Some cells display membrane blebs that are characteristic of apoptosis (black arrowheads). g By 4 h after cisplatin treatment, most cells appear apoptotic. Scale = 10 μm (a–g). h Quantification of morphologies observed following 2 h of treatment with 200 μM DHA or 4 h with 200 μM cisplatin. i Quantification and representative western blot of full-length and cleaved Gasdermin D (Gsdmd) for BV-2 cells treated with vehicle, 200 μM DHA, or 200 μM cisplatin for 2 h. Quantification depicts the ratio of cleaved Gsdmd to full-length Gsdmd relative to vehicle-treated control cells. j Flow cytometry analysis of BV-2 cells treated with vehicle, 200 μM DHA, or 1 μg/ml LPS for 2 h. Quantification depicts % cells positively labeled for iNOS (M1) or ARG1 (M2). N = 3, *P < 0.05, ***P < 0.001

