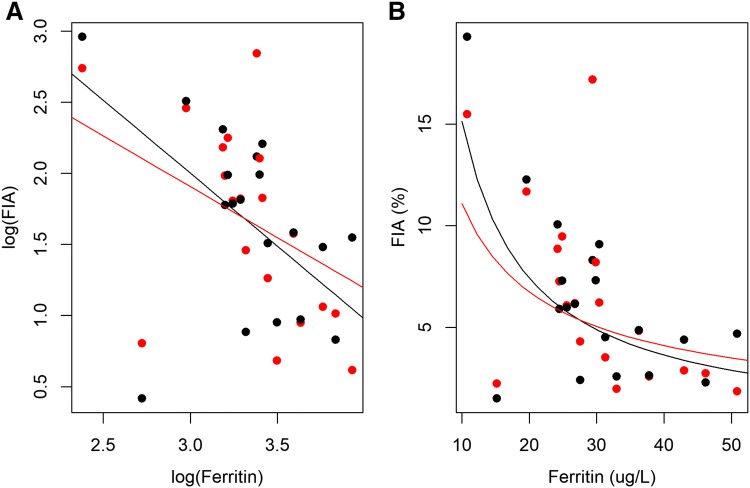
Fig. 2.
Scatterplot of fractional iron absorption values (FIA) over plasma ferritin concentration with regression lines. The regression lines are derived from the model: salt + log (ferritin) + salt × log(ferritin). a On a logarithmic scale, b on the original scale. Black dots/line FeSO4 and red dots/line Fe-picolinate. Slopes were not significantly different (p = 0.548)

