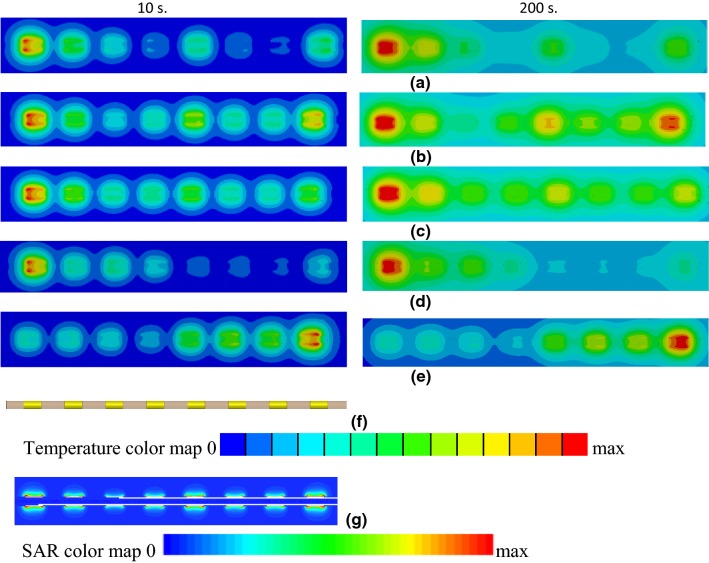
Fig. 8.
Temperature profiles in close proximity to electrodes of the lead with straight wire for RF exposure at 128 MHz after 10 s (left column) and 200 s (right column). Results are presented for leads surrounded by a blood, b generic tissue, and c nerve tissue. d, e Temperature profiles of 8 electrodes for RF exposure of the lead with helical wire in blood at 128 MHz for two different excitations. f Close-up view of the model with the electrodes. g SAR in close proximity to electrodes of the lead with straight wire in blood for an RF exposure of 128 MHz

