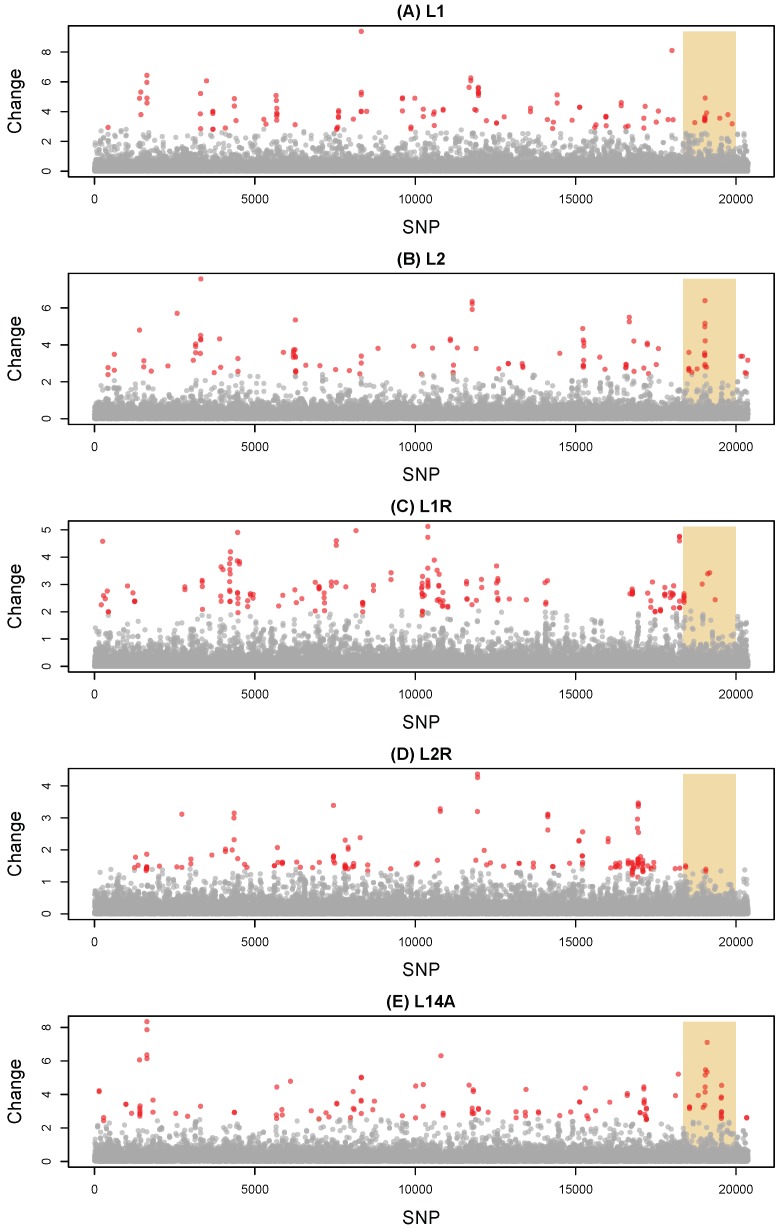
Figure 2.
Manhattan plots show standardized allele frequency change for each of 20,376 SNPs for five pairs of lines and samples (that is, allele frequency change relative to the ancestral, expected heterozygosity). Results are shown for (A) M to L1 F100, (B) M to L2 F87, (C) L1 F91 to L1R F46, (D) L2 F78 to L2R F45, and (E) L14 P to L14A F16. Points denote change for individual SNPs, which are organized along the x-axis by scaffold and position within scaffold. The shaded region denotes putative X-linked SNPs, whereas SNPs to the left or right of this region are autosomal or Y-linked. Points are colored to reflect their hidden state from the HMM, with gray for average change and red for exceptional change.

