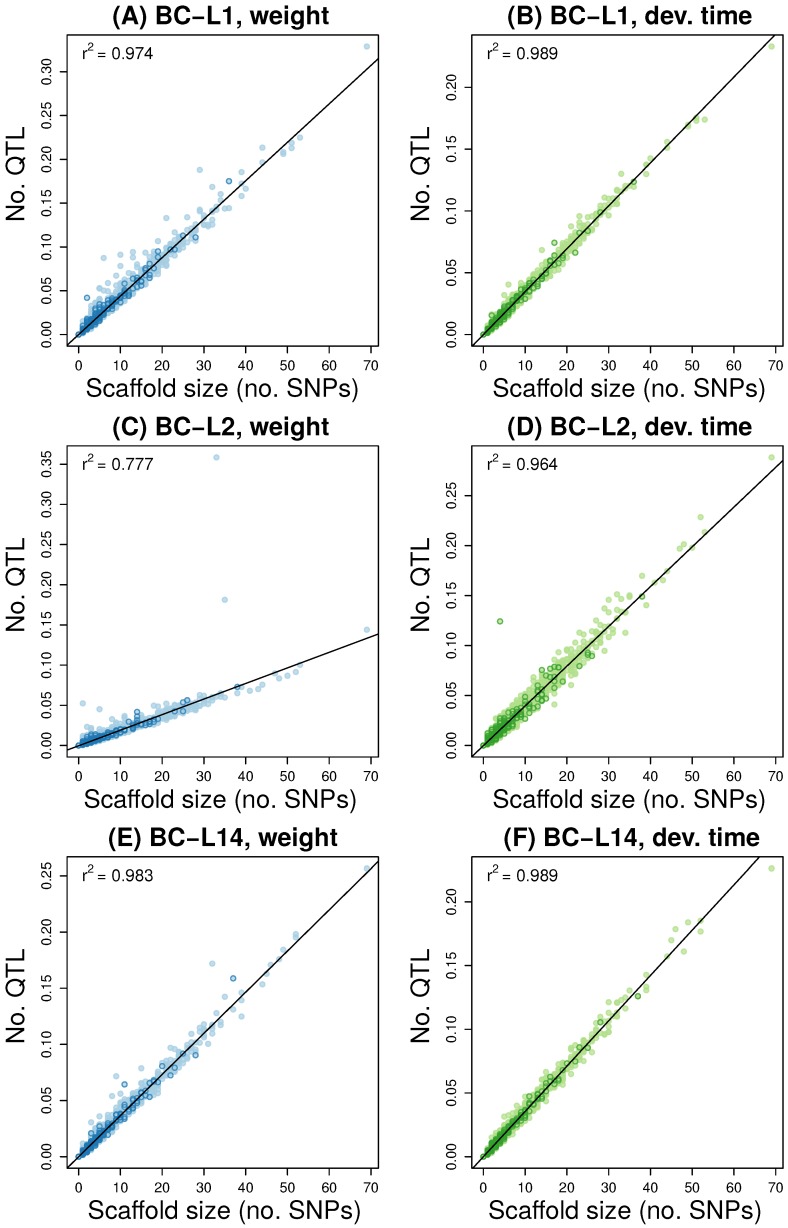
Figure 4.
The scatter plots depict Bayesian estimates for the number of QTL (i.e., causal variants) on each scaffold as a function of scaffold size (here measured as the number of SNPs). Results are shown for each back-cross line (BC-L1, BC-L2 and BC-L14) and trait (weight [A, C, and E] and development time [B, D, and F]). Points representing X-linked scaffolds are denoted with dark outlines. A best fit line from linear regression is given and the coefficient of determination () is reported. Points that fall well-above the best fit line harbor more QTL than expected given their size and a highly polygenic architecture of very small effect variants scattered evenly across the genome.

