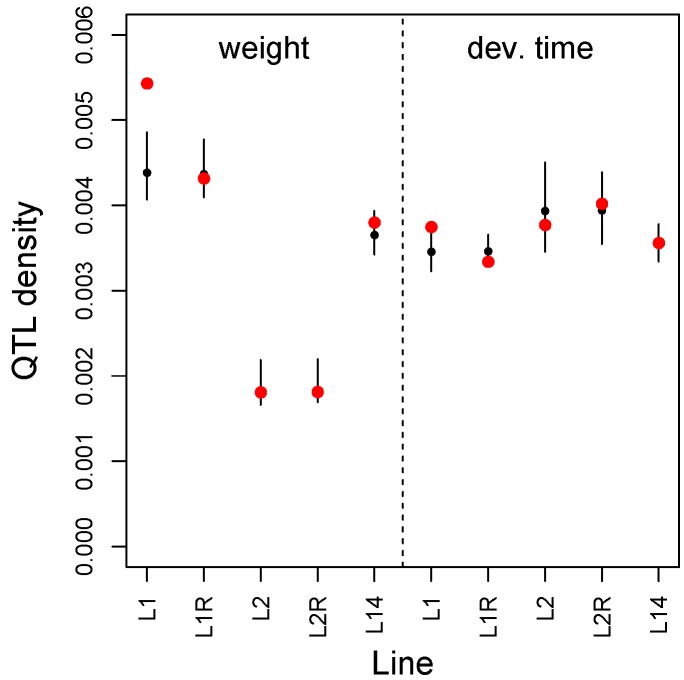
Figure 6.
Performance-trait QTL density (number of QTL per SNP) for SNPs exhibiting exceptional allele frequency change in the E&R experiments. Results are shown for adult weight and development time for each pair of lines or samples (see main text for details). Red dots denote the observed density. Black dots (median) and vertical lines (2.5th to 97.5th percentile) denote the null expectations from randomization tests.

