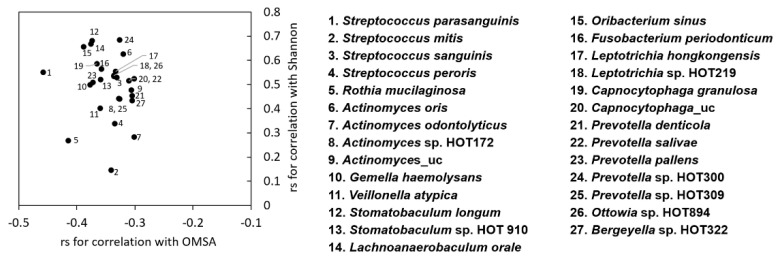
Figure 5.
Species negatively associated with the severity of oral mucositis. Correlations of the relative abundance of each species with the OMAS score and Shannon index were analyzed by the Spearman’s rank correlation test. Twenty-seven species, the relative abundance of which showed non-negligible correlations (rs ≥ │0.3│, p ≤ 0.004) with OMAS scores, were chosen. The graph presents the coefficients for correlation with OMAS and those for correlation with the Shannon index.

