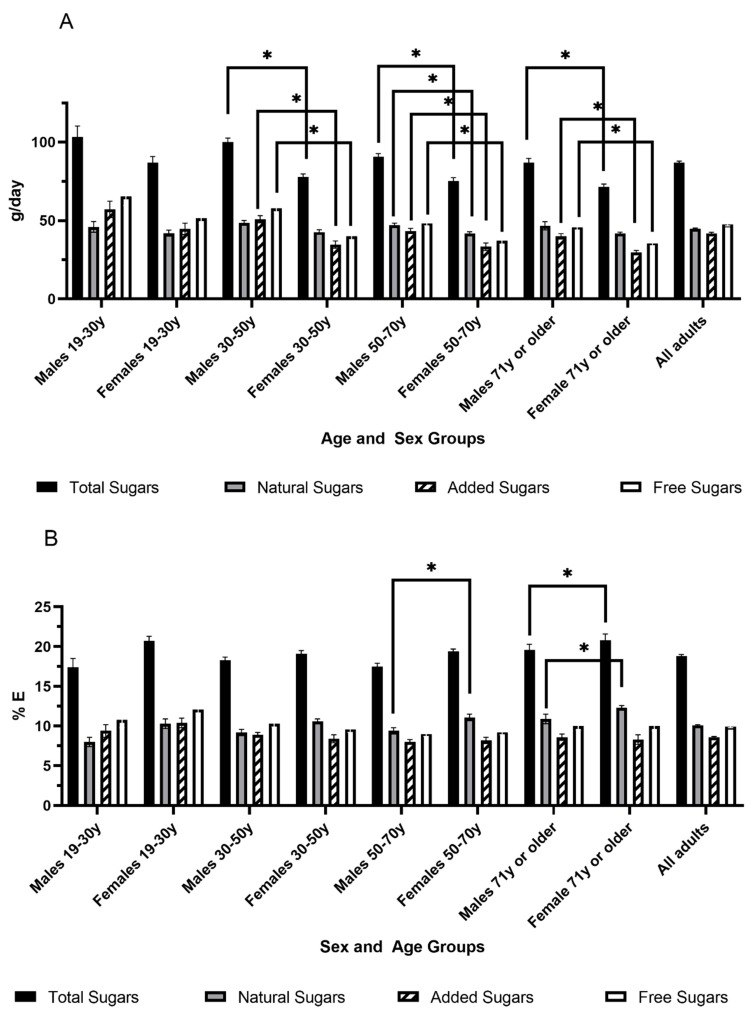
Figure 2.
Intake of total, natural, free and added sugars as g/day (A) and % energy/day (B) in Canadian adults (n = 11,817, aged 19 years and older) by age and sex groups. Values are expressed as Mean and Standard Error (SE). y: years old. * p < 0.05 compared to females of the same age range using a general linear model (PROC SURVEYREG), including the following covariates (Model 3): misreporting status (determined using previously published methods by Garriguet [47]), age, sex, smoking, self-perceived health, blood pressure, diabetes, heart disease, cancer, osteoporosis, education, physical activity, income, BMI, immigrant status and weekend reference day. The n number in each age group is: males 19–30 y: 765, females 19–30 y: 757, males 31–50 y: 1839, females 31–50 y: 1945, males 51–70 y: 1961, females 51–70 y: 2105, males 71 y+: 1105, females 71 y+: 1340.

