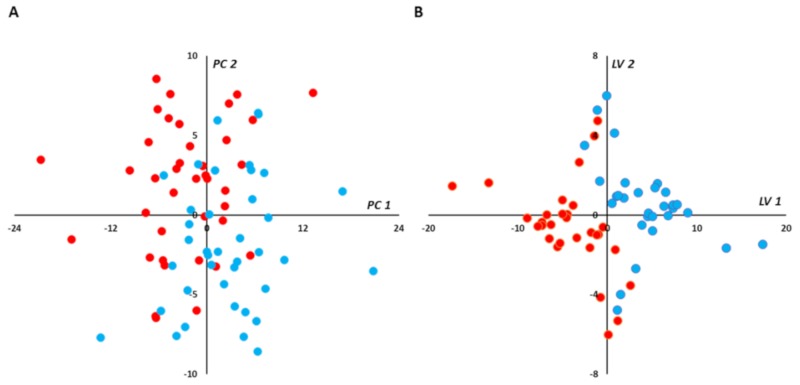
Figure 2.
(plasma): Multivariate unsupervised (A) and supervised (B) scatter plots constructed with plasma samples. (A) Principal component analysis (PCA) scatter plot built with all samples (39 in-crisis/39 out-of-crisis). No spontaneous grouping or outliers were detected in the first principal plan. (B) Partial least squares-discriminant analysis (PLS-DA) scatter plot built using median coordinates of best models and the 60 training set samples (30 in-crisis/30 out-of-crisis). A good separation was observed in the plan determined by two latent variables with only two samples misallocated. Legend: PC1,2: principal component 1 and 2, respectively. LV1,2: latent variable 1 and 2, respectively. Red circles correspond to samples drawn during vaso-occlusive crisis and blue circles to samples drawn after the crisis. Principal components and latent variables have no dimension (arbitrary units).

