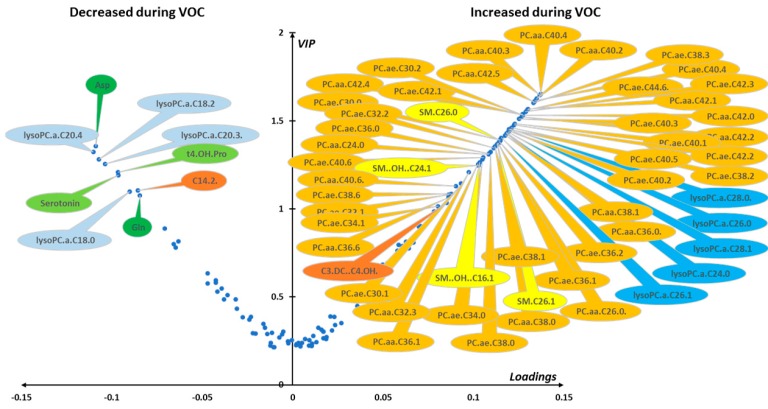
Figure 5.
(red blood cells). Loading vs. VIP (volcano plot) for PLS-DA models constructed from red cell samples. Median loading and VIP values were calculated for each metabolite using 7955 best models (BMs) (i.e., AUROCva ≥ 0.95). Only the most important metabolites, that is, those with VIP ≥ 1, have been labeled. Positive/negative loadings indicate increased/decreased metabolite concentrations between the in-crisis and out-of-crisis situation. The main features of the metabolomic signature are a relatively increased level during the crisis of 42 phosphatidylcholines (PC) with 17 diacyl phosphatidylcholines (PC aa) and 25 alkyl-acyl phosphatidylcholines (PC ae), 4 sphingomyelins (SM), malonyl-carnitine (C3-DC), and 5 lysophosphatidylcholines species (LPCs) with acyl chain length longer than 22 carbons. On the other hand, four LPCs with acyl chain length of less than 22 carbons were relatively decreased during the VOC along with aspartate (Asp), glutamine (Gln), trans-4-hydroxyproline (t4-OH-Pro), serotonin, and tetradecadienyl-carnitine (C14:2). Color code for metabolite bubbles: amino acids: green; biogenic amines: light green; acyl-carnitines: brown; lysophosphatidylcholines with less than 22 carbons on their acyl group: light blue; lysophosphatidylcholine with more than 22 carbons on the acyl group: dark blue; phosphatidylcholine: orange; sphingomyelins: yellow. For phosphatidylcholines, the sum of the length of the two acyl or acyl-alkyl groups is noted after the C and is followed by the number of double bonds. The same notation is used for representing the length and the number of double bonds in the acyl chain of lysophosphatidylcholines and (hydroxy) sphingomyelins. VOC: vaso-occlusive crisis.

