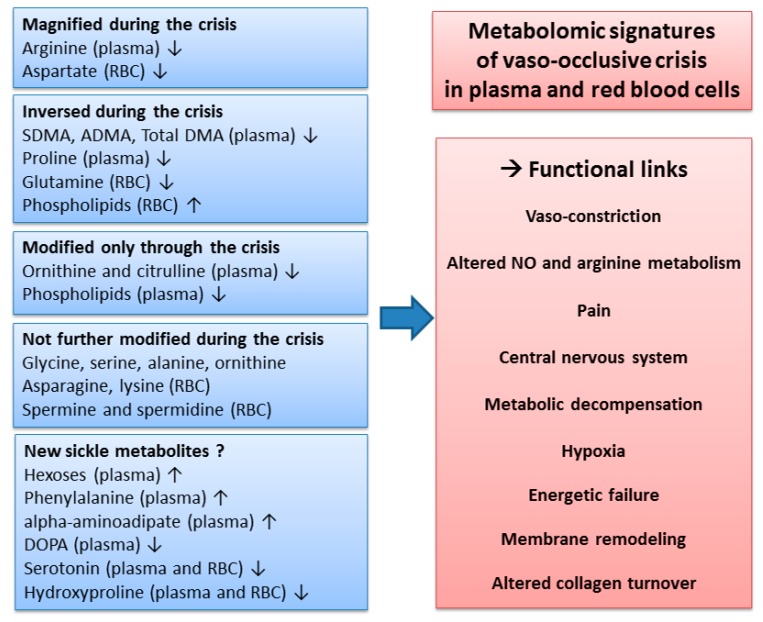
Figure 6.
Overview of the metabolomic signature, with potential functional links, of the vaso-occlusive crisis, in plasma and red blood cells. The changes in metabolite concentrations during the crisis observed in our study were compared to the changes reported in the literature during the steady state. ↑: increased concentrations; ↓: decreased concentrations.

