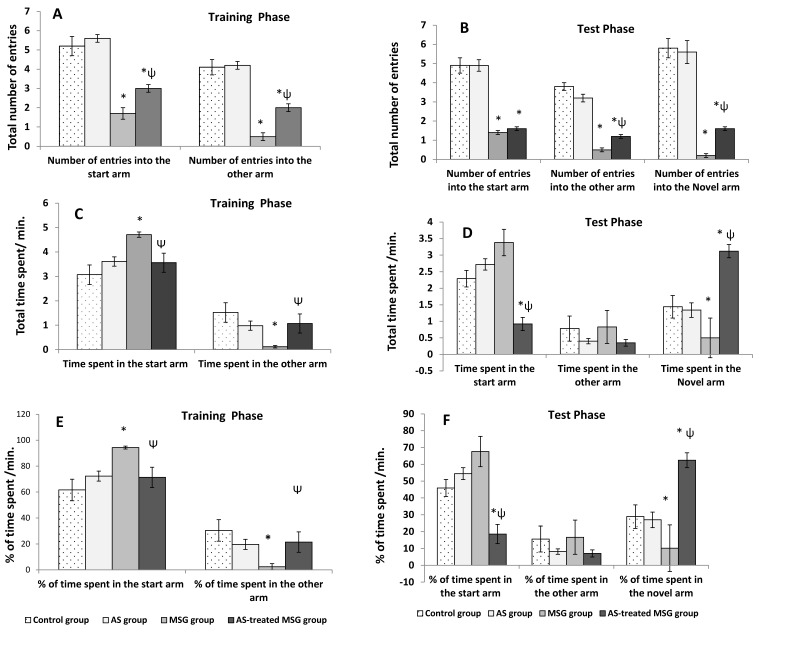
Figure 4.
Short-term spatial memory tested by modified T-maze in different studied groups: (A) the number of entries in the training phase; (B) the number of entries in the test phase; (C) the time spent in the training phase; (D) the time spent in the test phase; (E) the percentage of time spent in the training phase; (F) the percentage of time spent in the test phase. Data are expressed as mean ± S.E.M. (n = 10). * p < 0.05, vs. control; ψ p < 0.05, vs. MSG.

