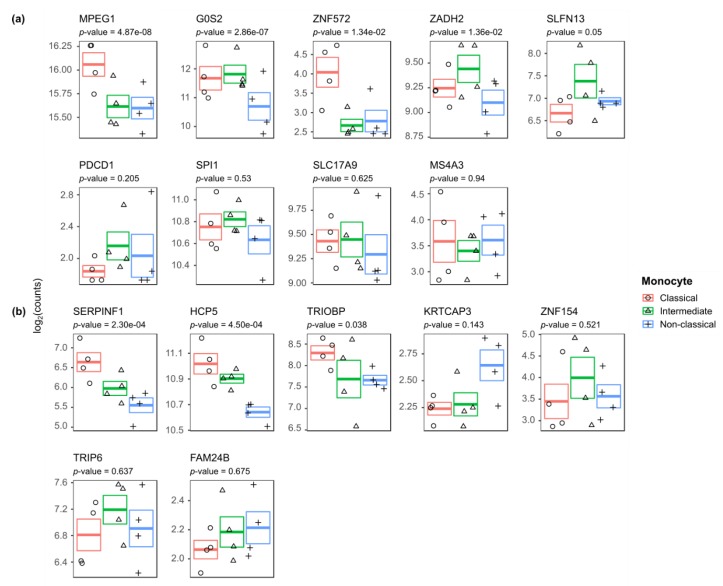
Figure 4.
Gene expression of the (a) CD vs. non-CD and (b) CD-active vs. CD-remissive DMGs across the different monocyte subsets. Visualization of the log2(counts) with standard error for classical, intermediate and non-classical annotated with the p-value as obtained from the likelihood ratio test.

