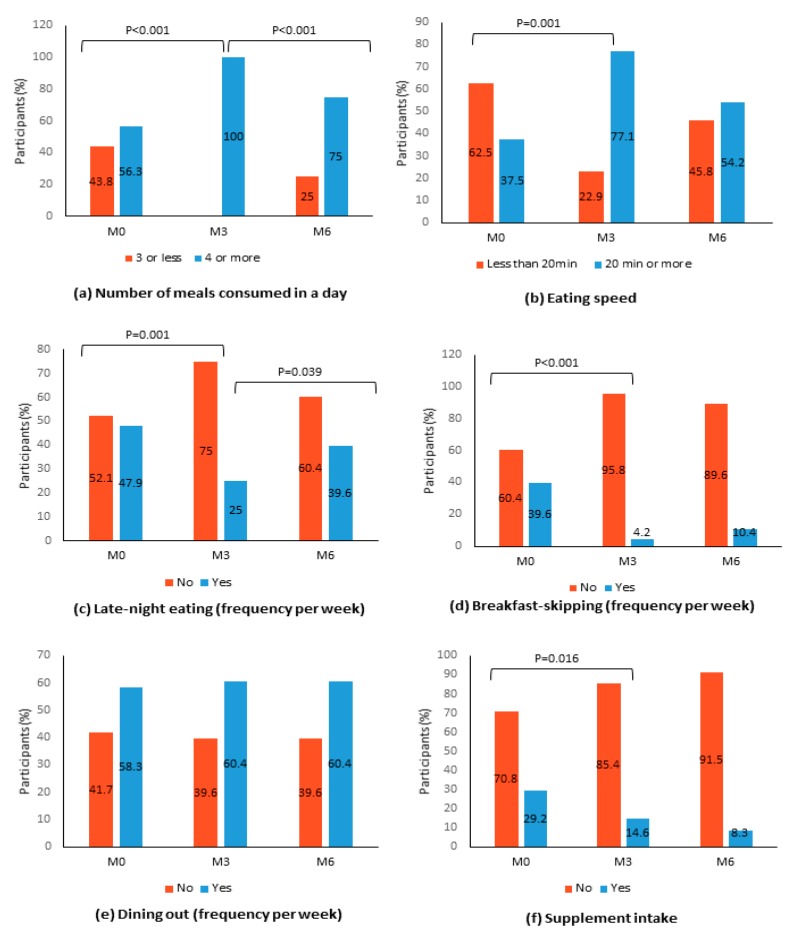
Figure 2.
Distribution of study participants according to dietary behaviors at baseline (M0), 3-months post-intervention (M3), and 6-months post-intervention (M6) (N = 48). Note: The McNemar test was performed between baseline (M0) and post-intervention (M3) and between post-intervention (M3) and post-follow-up (M6). Only statistically significant p values (p < 0.05) are shown.

