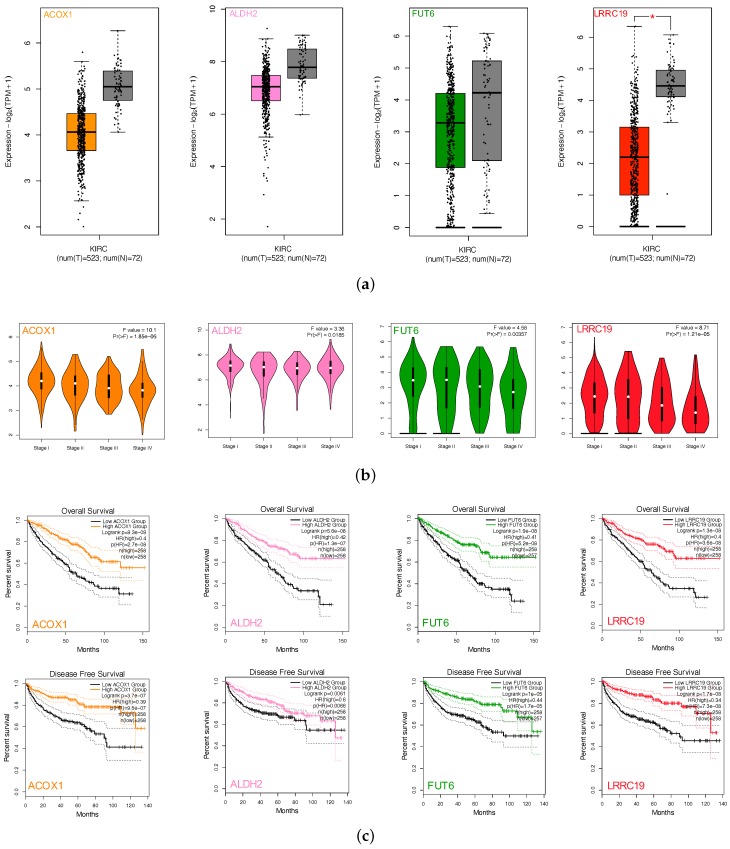
Figure 5.
Screen and validation of intersection genes. (a) Validation of ACOX1, ALDH2, FUT6, and LRRC19 differential expression in KICR on GEPIA2. Box plots show that there was a significant differential expression of LRRC19 between KIRC cases and normal cases (|| > 1 and p < 0.05). (b) Stage plots of intersection genes expression with tumor stage in KICR on GEPIA2. Violin plots show ACOX1, FUT6, and LRRC19 were significantly downregulated in Stage IV (p < 0.001). (c) Kaplan–Meier plots show the prognostic value of ACOX1, ALDH2, FUT6, and LRRC19. Overall and disease-free survival curves were generated for the comparison of survival percent between groups with high and low gene expression (p < 0.01 in Log-rank test). (d) Validation of DIO1, GPX3, and LRRC19 expression fold change in independent GEO cohorts, GSE781 and GSE6344. (e) Multivariate analysis of the correlation of LRRC19 expression with OS among KIRC patients. The columns in the forest plot are parameter, number of patients, HR (IC 95%), and p value. (* p < 0.05, ** p < 0.01, *** p < 0.001).


