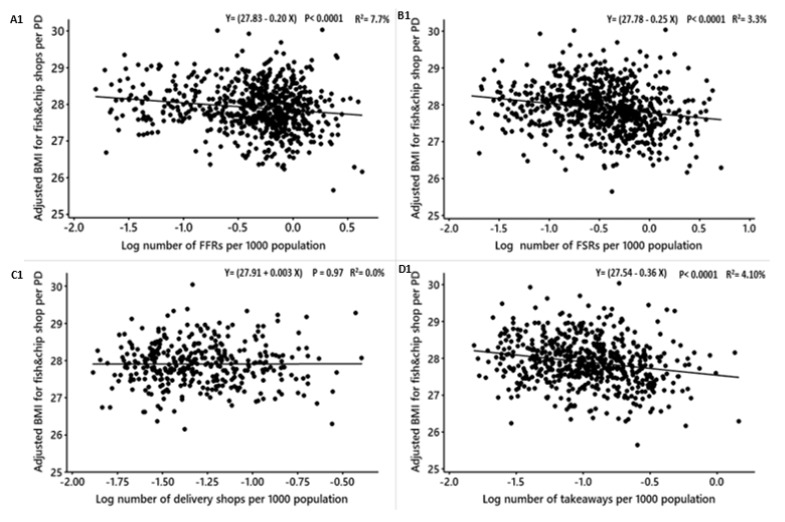
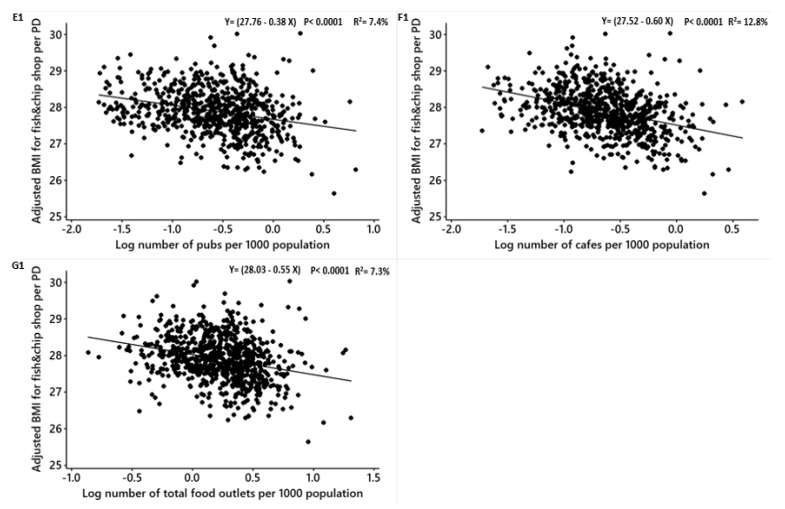
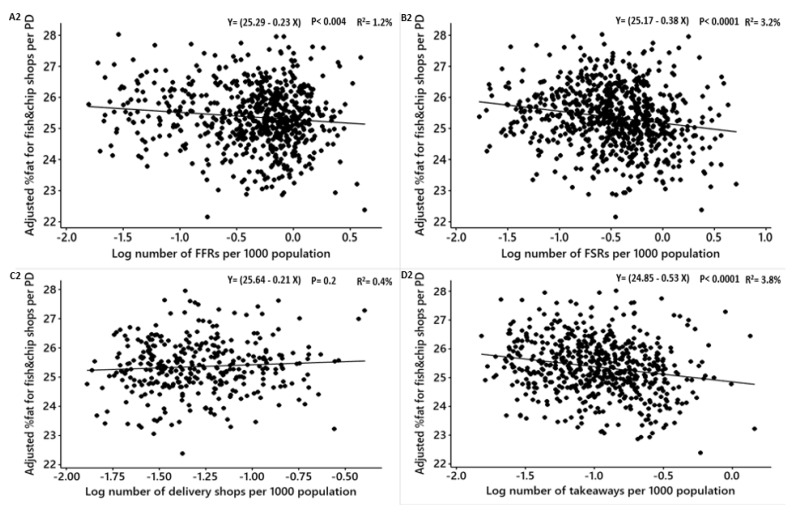
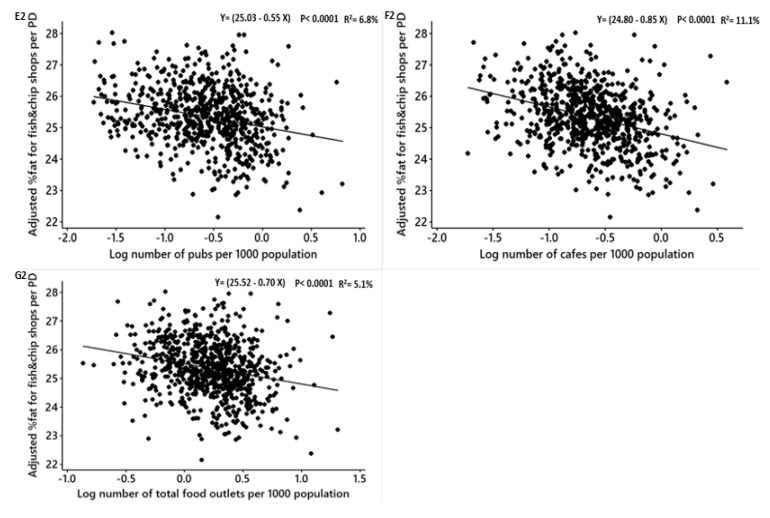
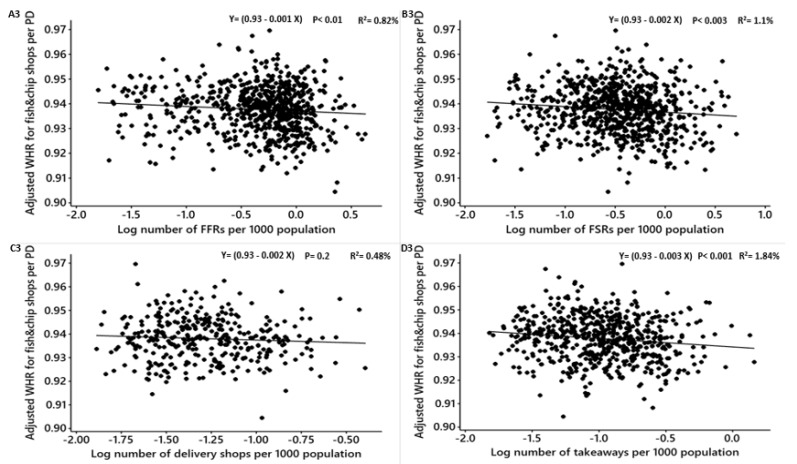
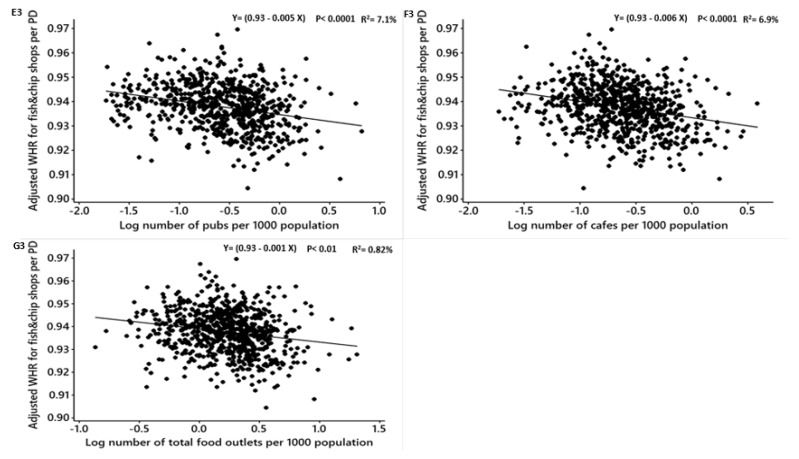
Figure 5.
Males: Linear regression analysis of the association between log-transformed numbers of food outlets per 1000 population and adjusted obesity measures. Obesity measures adjusted for deprivation level per household, education, employment, ethnicity, household size, household income, age and density of fish and chip shops. BMI = Body Mass Index, WHR = Waist to Hip Ratio. FFR = Fast-Food Restaurants, FSR = Full-Service Restaurants, total food outlets = combined.

