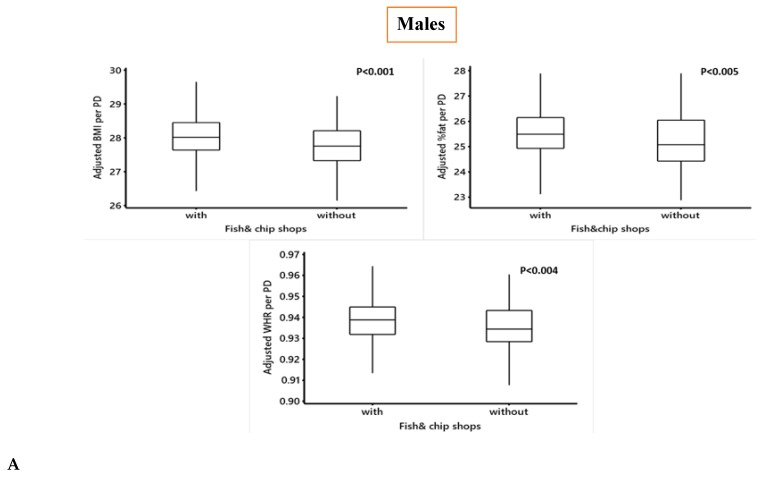
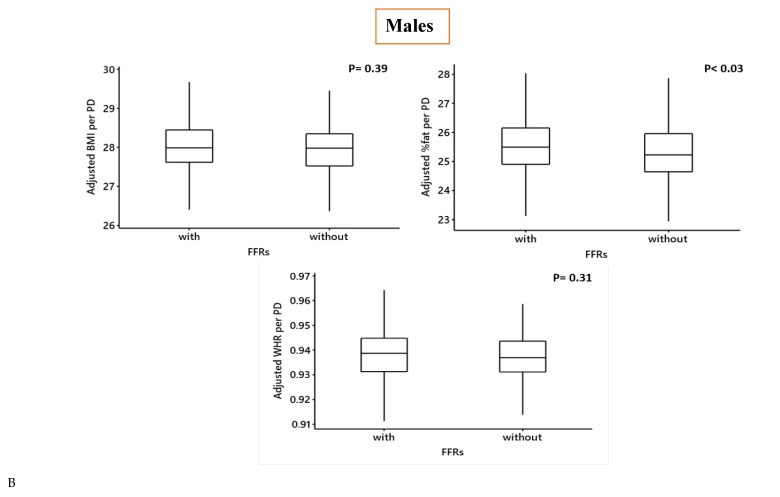
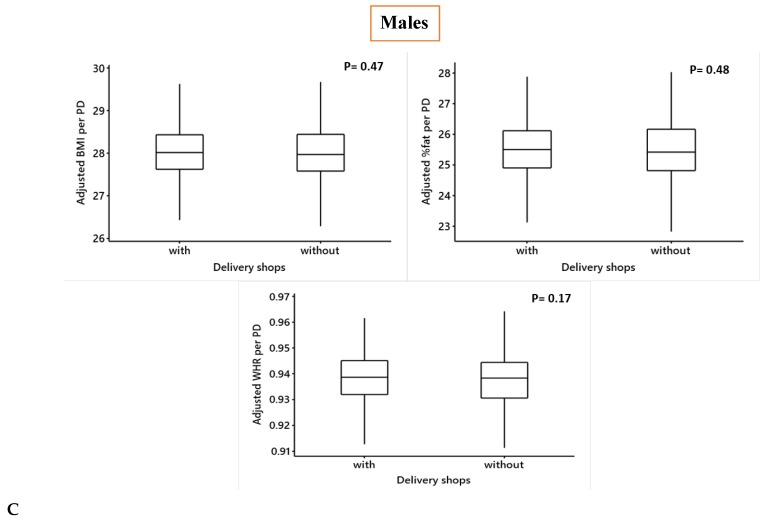
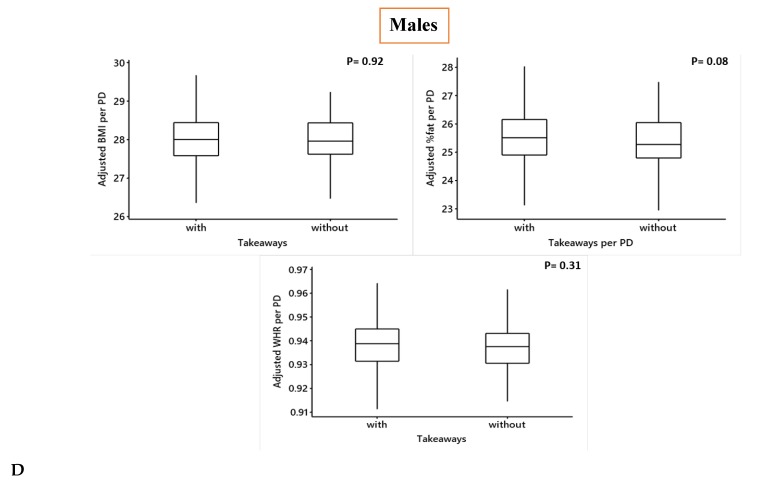
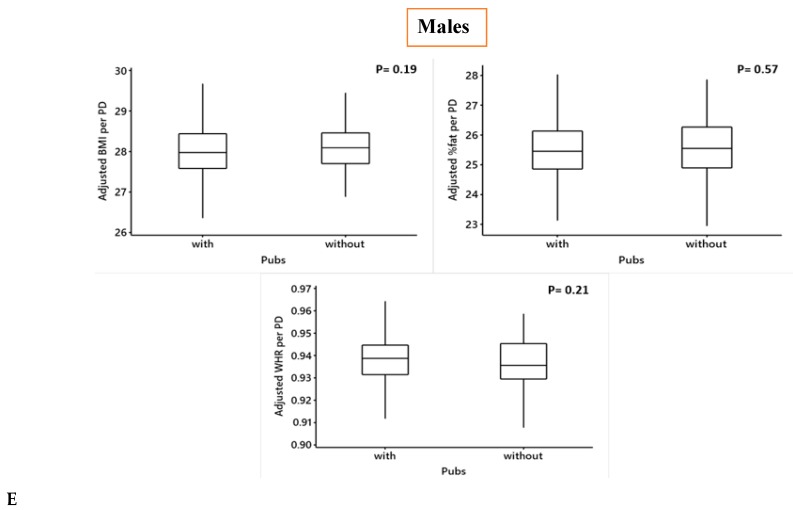
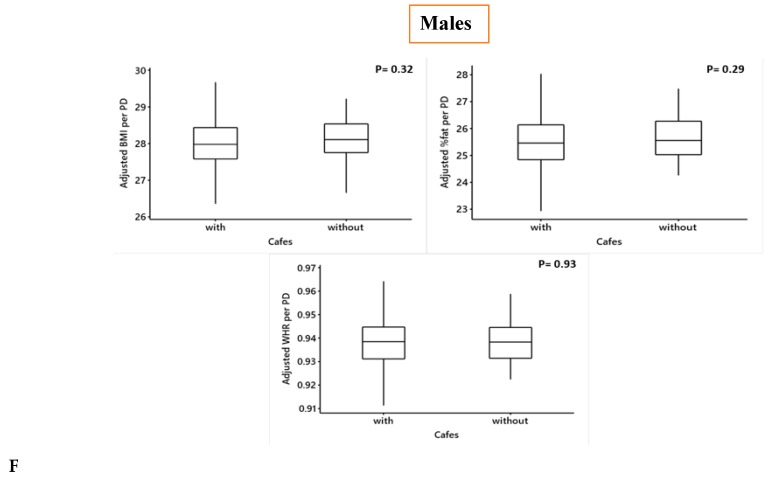
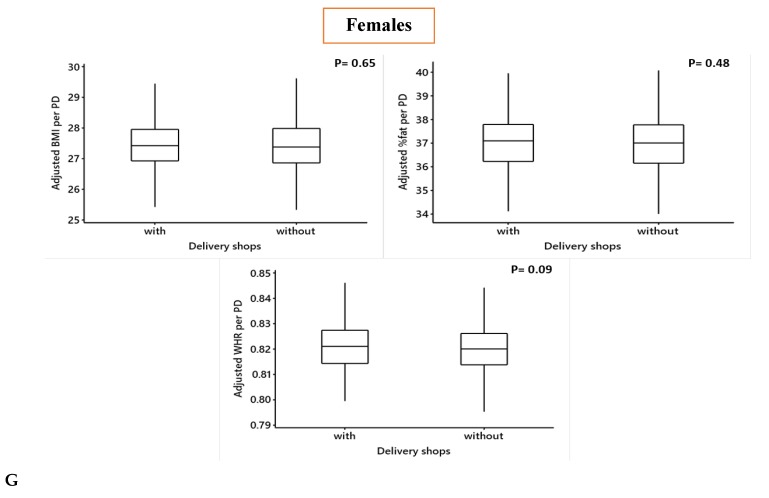
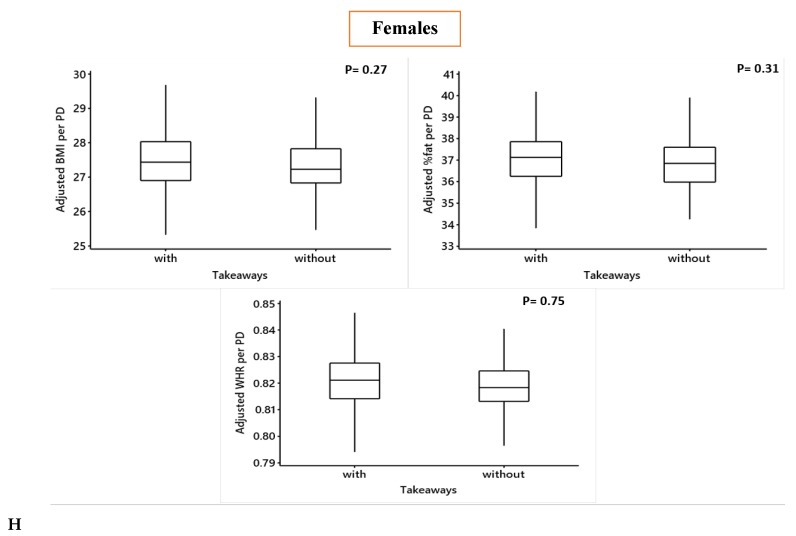
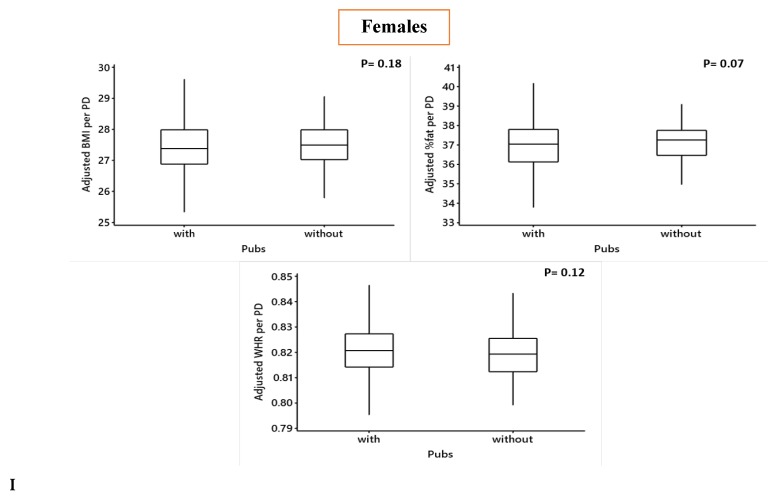
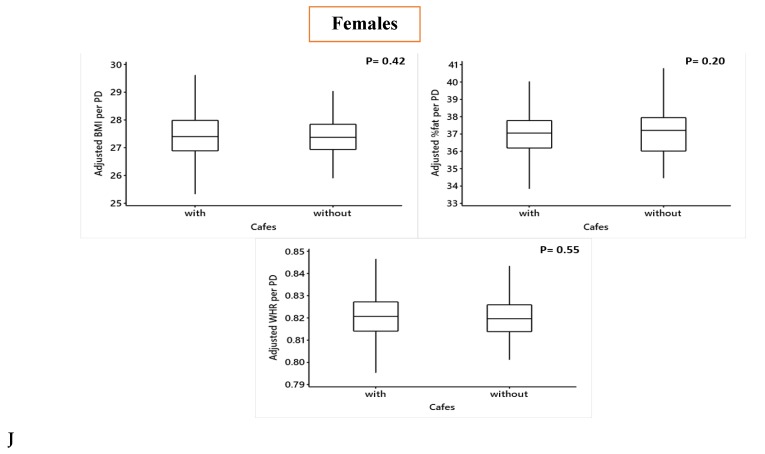
Figure A3.
Comparing the adjusted means of BMI, WHR and %fat for males and females in PDs in which some of the given food outlet types were present or absent. Obesity measures adjusted for deprivation level per household, education, employment, ethnicity, household size, household income and age. BMI= Body Mass Index, WHR = Waist to Hip Ratio. Males: A = fish & chip shops, B = Fast-Food Restaurants, C = Delivery shops, D = Takeaways, E = Pubs, F = Cafes; Females: G = Delivery shops, H = Takeaways, I = Pubs, J = Cafes.

