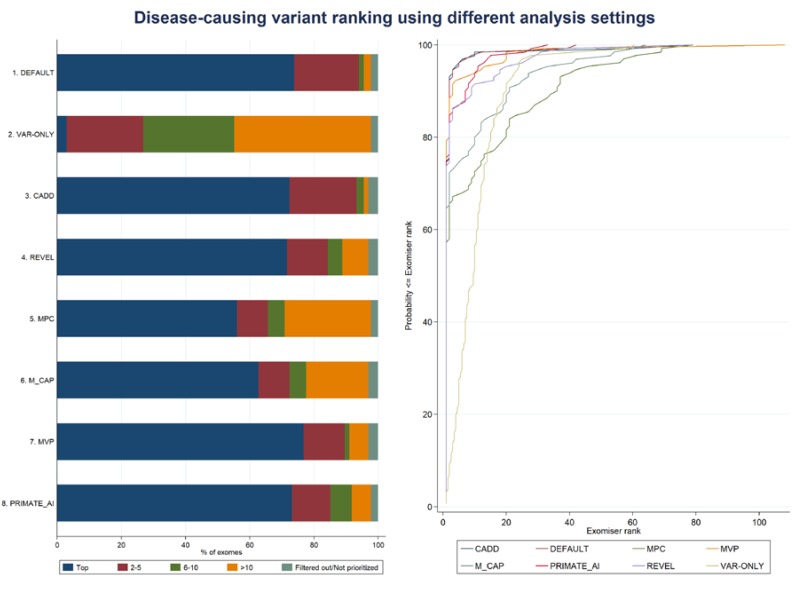
Figure 3.
Exomiser performance on the IRD patient dataset using different analysis settings. The left-hand side panel shows the categorical percentage distribution of the disease-causing variant ranking according to five mutually exclusive disease-causing ranking bins (“Top”, “2–5”, “6–10”, “>10”, and “Filtered out/Not prioritized”) per each analysis setting. The right-hand panel shows the corresponding cumulative percentage distributions.

