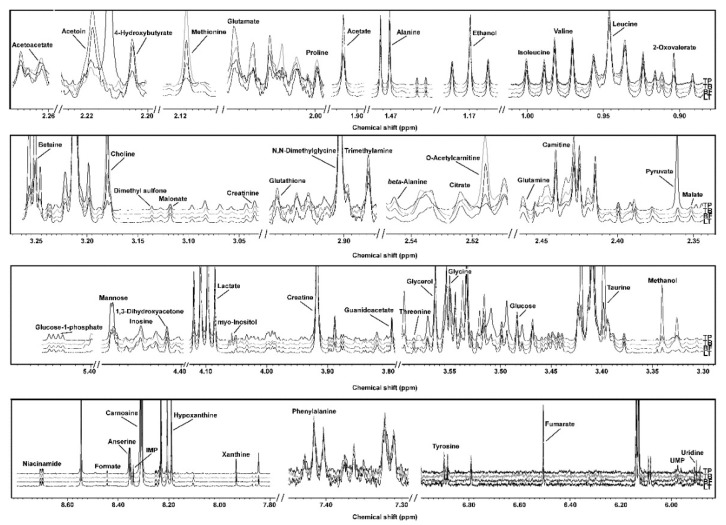
Figure 1.
1H-NMR spectra from trapezius (TP), triceps brachii (TB), biceps femoris (BF) and longissimus thoracis (LT), representative of all the registered spectra. The name of each molecule appears over the signal used for its quantification. To ease the reader’s visual inspection, for each portion a spectrum with a convenient signal-to-noise ratio has been selected. The entire spectra and molecules identification is shown in Figures S2–S13.

