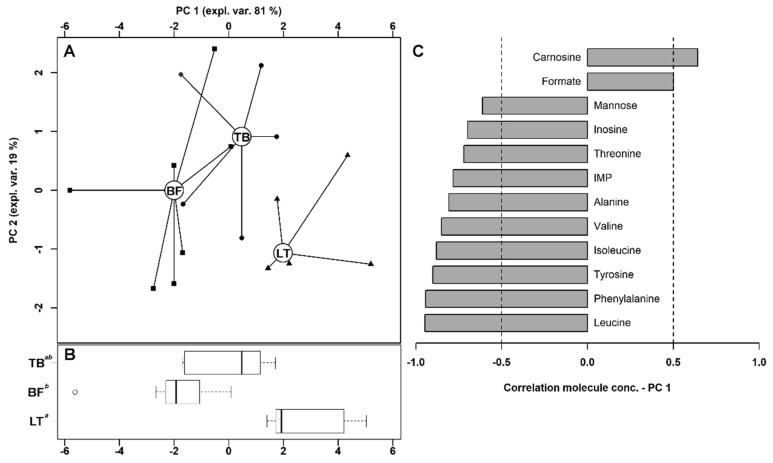
Figure 2.
rPCA model built of these concentration of the molecules showing statistically significant differences among different groups. In the scoreplot (A), samples from the three groups are represented with triangles (LT), circles (TB) and squares (BF). The wide, empty circles represent the median of each samples’ group. In the boxplot (B), the position of the samples along PC 1 is summarized. Different superscript letters identify significantly different groups (p < 0.05). The loading plot (C) reports the correlation between the concentration of each substance and its importance over PC 1.

