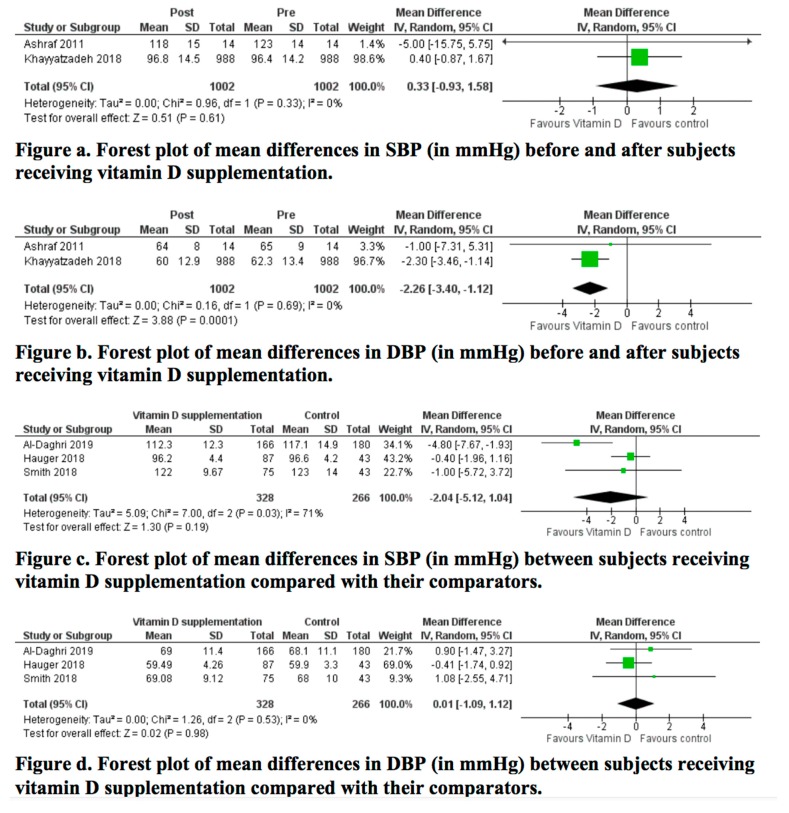
Figure 4.
Meta-analysis of effects of vitamin D supplementation on SBP and DBP. Mean differences for each study are represented by squares, and 95% CIs are represented by the lines through the squares. The pooled mean differences are represented by diamonds. Between-study heterogeneity was assessed with the use of the I2 statistic. SBP: systolic blood pressure; DBP: diastolic blood pressure.

