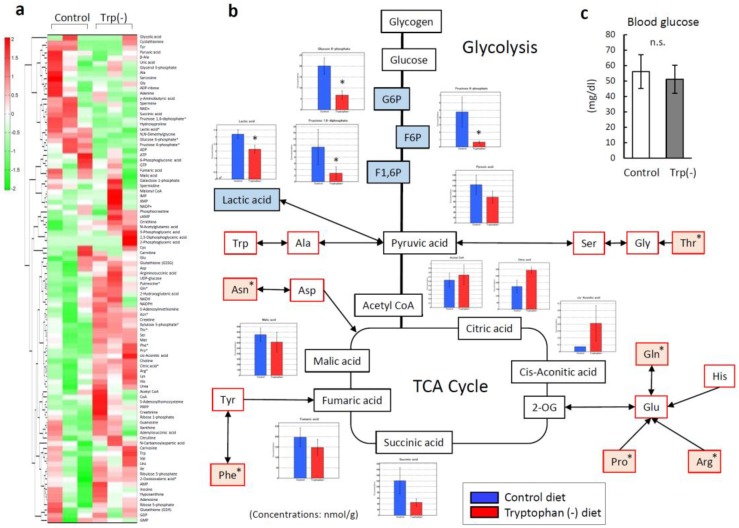
Figure 6.
Metabolic responses in the skeletal muscle of mice fed a control diet and a tryptophan (Trp)-deficient diet. (a) Metabolic pathway enrichment analysis. (b) Levels of metabolites involved in the glycolytic pathway and tricarboxylic acid cycle in the gastrocnemius. (c) Blood glucose levels on day 21. Data are the means and standard deviations (n = 3). * p < 0.05. G6P: glucose 6-phosphate; F6P: fructose 6-phosphate; F1,6P: fructose 1,6-diphosphate.

