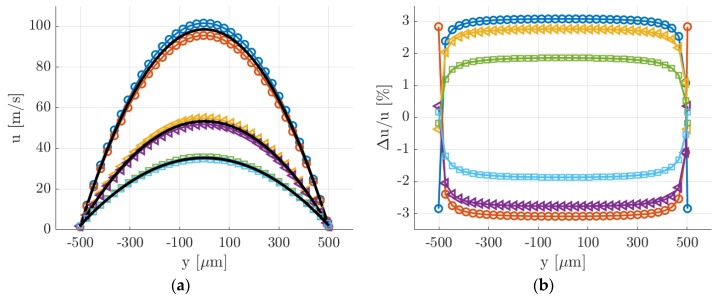
Figure 8.
(a) Analytical velocity profiles at = 100 s (O), 1000 s (◁), and 2000 s (☐) during the experimental run. The evolution of during the recording of = 20 consecutive images is illustrated. At each time , the figure reports: the velocity profile captured by the first image of the group; the velocity profile captured by the last image of the group; the average velocity profile (solid black lines) that the image resulting from the average of the images would represent. (b) Relative variation of the velocity profile with respect to the average velocity profile at = 100 s (O), 1000 s (◁), and 2000 s (☐).

