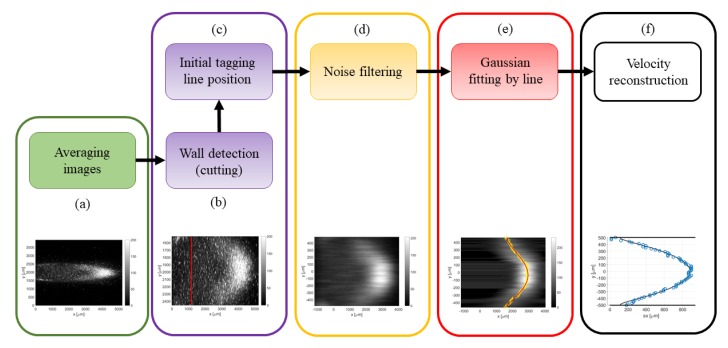
Figure 9.
Flow chart of the image post-processing: (a) image averaging; (b) detecting wall position and image cutting; (c) detecting tagged line position; (d) filtering background noise; (e) Gaussian fitting per each horizontal line of pixels; and (f) velocity reconstruction from the displacement data .

