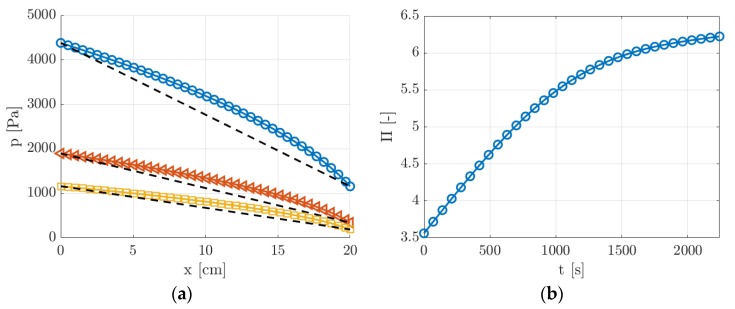
Figure 12.
(a) Pressure distribution along the channel length at three different times = 100, 1000, and 2000 s during the experimental run, which correspond to pressure ratios = 3.8 (O), 5.5 (◁), and 6.2 (☐). The dashed lines represent the linear pressure distributions when rarefaction and compressibility effects are neglected; (b) time evolution of pressure ratio during the experimental run.

