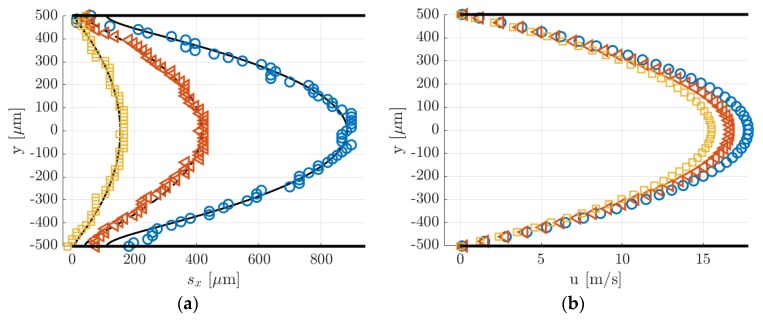
Figure 14.
(a) Displacement data computed by applying the Gaussian fitting per line to the images of Figure 13. The black lines represent the numerical solutions for the displacement profile provided by the reconstruction method; (b) velocity reconstruction from the displacement data in (a): = 10 µs (☐), 25 µs (◁), and 50 µs (O).

