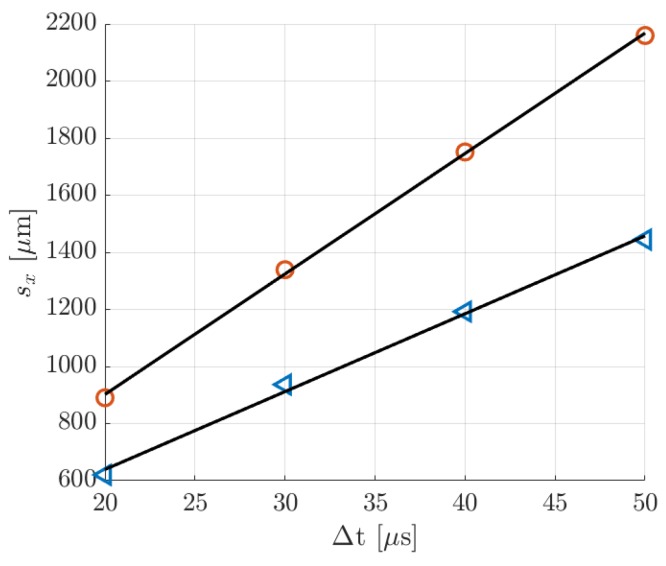
Figure 20.
Mean molecular displacement in helium flow at delays = 20, 30, 40, and 50 µs: (O) data at 1.6 kPa; (◁) data at 920 Pa. The black solid line represents the linear interpolation of the MTV data, which provides an average velocity = 42.2 m/s for the data at 1.6 kPa and = 27.28 m/s for the data at 920 Pa.

