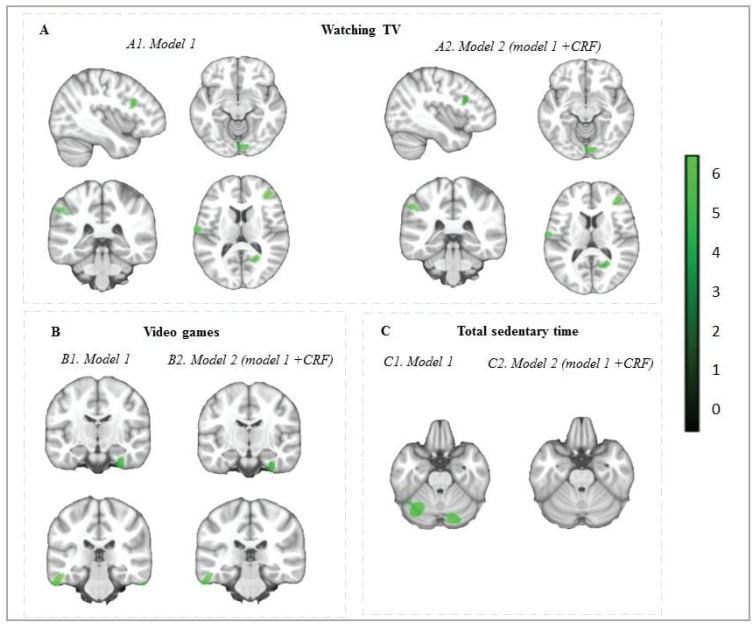
Figure 1.
Brain regions showing negative separate associations of (A) watching TV, (B) video games and (C) total sedentary time with gray matter volume in children from the ActiveBrains projects. Analyses were adjusted for sex, peak height velocity offset (years), parent education university level (neither/one/both) and body mass index (kg/m2) in model 1, and model 2 was adjusted for model 1 plus cardiorespiratory fitness (CRF, mL/kg/min). Maps were thresholded using AlphaSim at p < 0.001with k = 77 voxels for model 1 and k = 75 for model 2 for watching TV, k = 44 voxels for model 1 and k = 45 for model 2 for video games, and k = 62 voxels for model 1 and k = 46 for model 2 for total sedentary time and surpassed the Hayasaka correction (see Table 2). The color bar represents T-values, with a lighter green color indicating a higher significant association. Images are displayed in neurological convention (i.e., the right hemisphere corresponds to the right side in coronal displays). Sagittal planes represent the left hemisphere. No brain regions showed a statistically significant positive association between any sedentary behavioral variable and gray matter volume.

