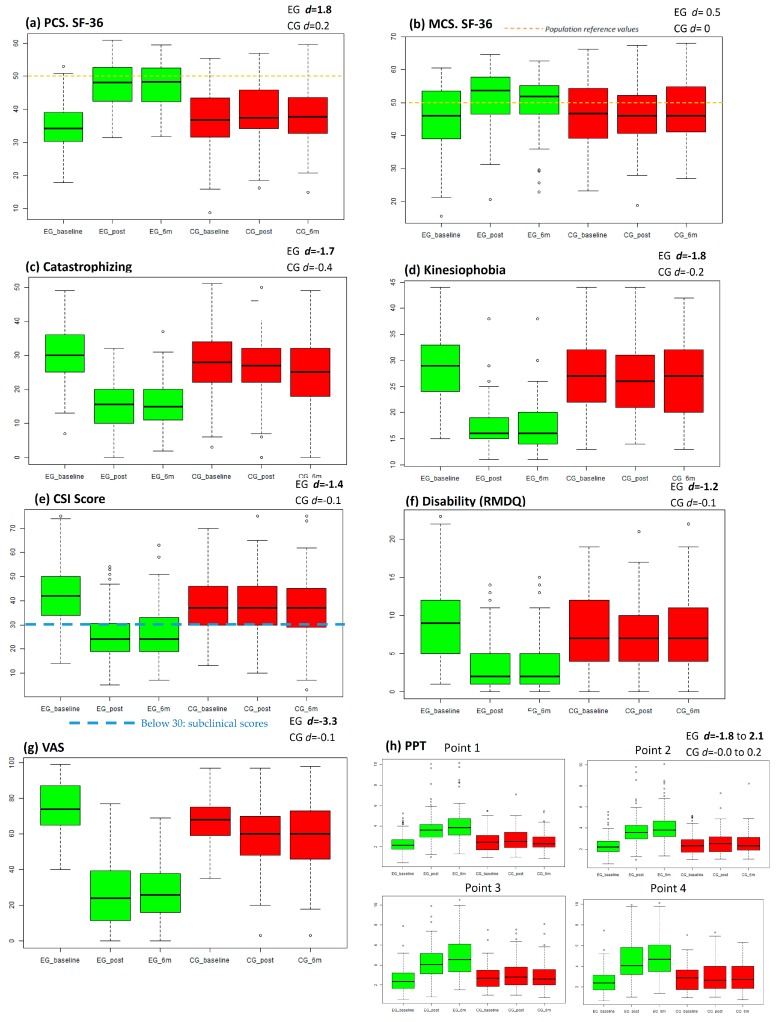
Figure 3.
Outcome graphical representation. This figure contains outcomes graphical representation in boxplot. Green colour represent experimental group (EG) and red colour represent control group (CG). First boxplot represents the initial assessment, the second boxplot represents post-intervention assessment and the third the assessment at six months; (A) Boxplot for physical component summary (PCS); (B) Boxplot for mental component summary (MCS); (C) Boxplot for catastrophism outcomes; (D) Boxplot for kinesiophobia outcomes (TSK-11); (E) Boxplot for CSI scores (part A); (F) Boxplot for disability (RMDQ); (G) Boxplot for intensity of pain (VAS; (H) boxplot for PPT outcomes; EG d = X.X: Experimental Group effect size at six months (Cohen’s d); CG d = X.X: Control group effect size at six months. Hollow circles represents outlier values.

