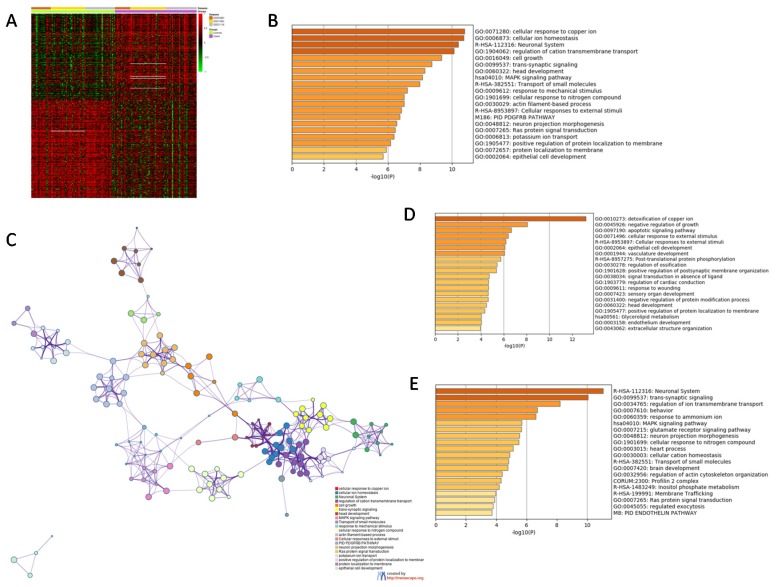
Figure 1.
(A) Heatmap of the differentially expressed genes (DEGs) identified from the meta-analysis of the GSE53987, GSE12649 and GSE21138 datasets; (B) histogram showing the most enriched terms among the DEGs identified in the meta-analysis; (C) network showing the interconnection among the most enriched terms among the DEGs identified in the meta-analysis; (D) histogram showing the most enriched terms among the upregulated DEGs identified in the meta-analysis; (E) histogram showing the most enriched terms among the downregulated DEGs identified in the meta-analysis.

