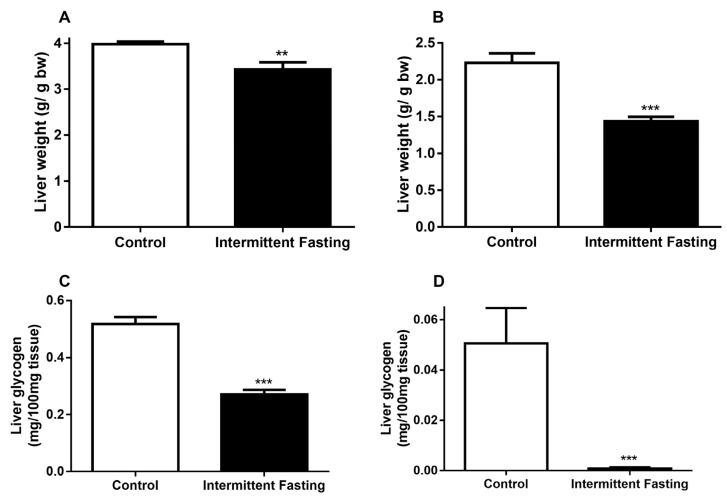
Figure 5.
(A) Liver weight before and (B) after 24h of fasting, (C) liver glycogen content before and D) after 24h of fasting of Wistar rats submitted to IF for 12 weeks. The results are presented as the means ± standard error of the mean (SEM) with 10 different animals for each group. ** p <0.005 and *** p <0.0005 compared to the control of the same period, as indicated by Student’s t-test.

