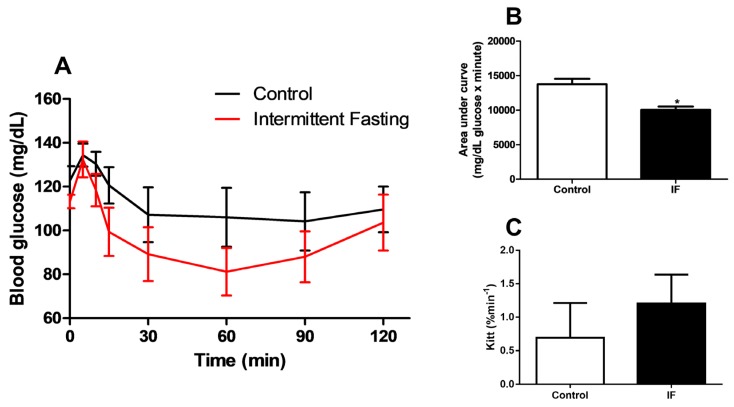
Figure 7.
(A) Intraperitoneal insulin tolerance test (iITT), (B) area under curve and (C) glucose decay constant rate during insulin tolerance test (kITT) of Wistar rats submitted to IF for 12 weeks. The results are presented as means ± standard error of the mean (SEM) with 5 different animals for each group. * p <0.05 compared to the control, as indicated by Student’s t-test (B and C), two-way ANOVA followed by Sidak’s multiple comparisons test (A).

