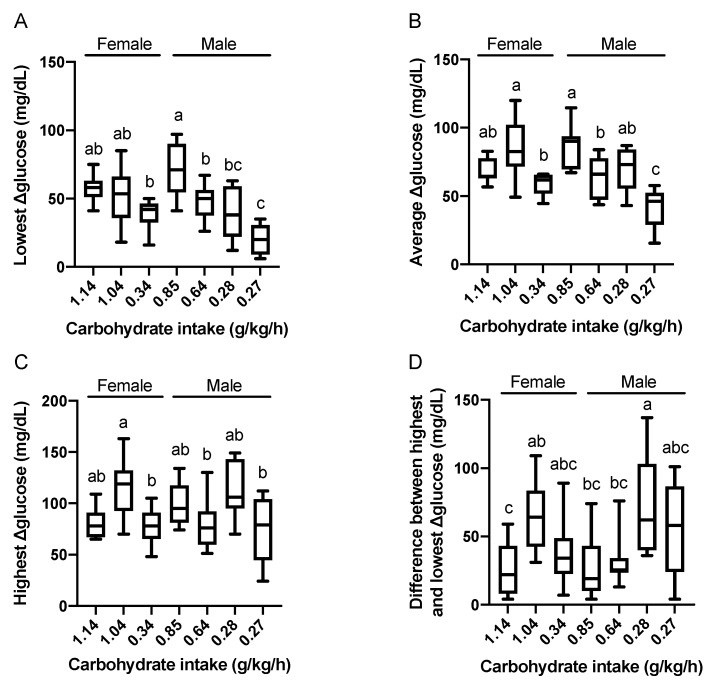
Figure 4.
Relationships between carbohydrate intake and the lowest (A), average (B), highest (C), and the difference between the highest and lowest (D) value of Δglucose levels. Carbohydrate intake of each runner is expressed in the X-axis. Data are expressed using box-and-whisker plots to indicate the minimum, first quartile, median, third quartile, and maximum. Bar height indicates the average of the dots. Values without common superscript are significantly different, P < 0.05

