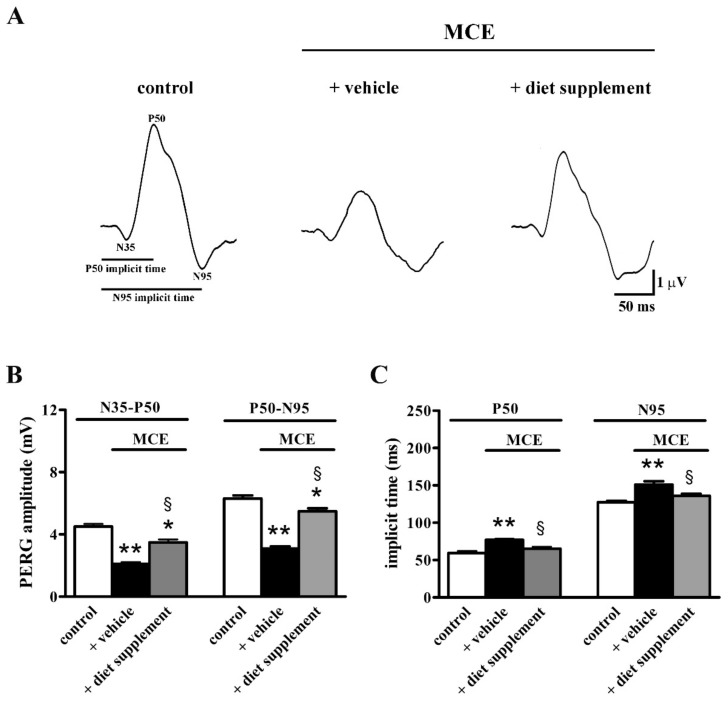
Figure 3.
Effects of dietary supplementation on retinal function as evaluated by pattern ERG (PERG). (A) Representative PERG traces showing the two negative peaks (N35 and N95) and the positive peak P50 in control mice and in mice injected with MCE fed with either vehicle or diet supplement. (B) Mean amplitudes of the N35–P50 and P50–N95 waves. MCE reduced the amplitude of both waves, an effect that was partially prevented by dietary supplementation. (C) Mean implicit time of the P50 and N95 peaks was increased by MCE, an effect that was abolished by dietary supplementation. Data are shown as mean ± SEM (n = 6 for each group). * p < 0.01 and ** p < 0.001 versus control; § p < 0.001 versus MCE mice fed with vehicle (one-way ANOVA followed by the Newman–Keuls multiple comparison post-hoc test).

