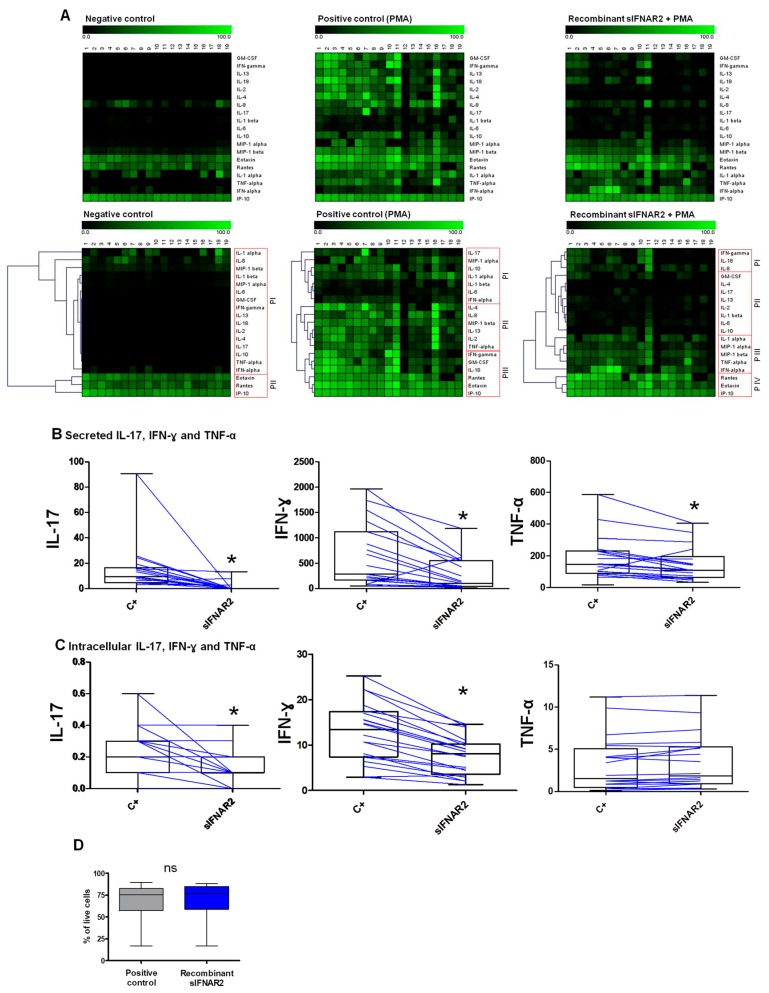
Figure 1.
Immunomodulatory activity of recombinant sIFNAR2. (A) Heatmaps showing the production of secreted cytokines, chemokines and growth factors in human cells in the presence of recombinant sIFNAR2. Each metabolite was normalized by the maximum value obtained. Each column represents a subject and each row represents a metabolite. A higher intensity of the green color represents a higher production of the molecule (above). Non-supervised average linkage hierarchical clustering grouped the proteins with similar expression patterns (P) and they were numbered PI, PII, PIII or PIV in each map. The clustering was executed with Genesis software (below). (B) Secreted IL-17, IFN-ɣ, and TNF-ɑ were assessed by Luminex (pg mL−1).The data have been depicted in groups (as box-plots) and individually (as lines in order to show intra-individual changes). The cells exposed to recombinant sIFNAR2 were compared to the positive control (c+) (Wilcoxon Rank test). N =19 * p< 0.01. (C) Intracellular IL-17, IFN-ɣ, and TNF-ɑ in CD45+ T cells were assessed by flow cytometry. The data show the percentage of positive cells expressing IL-17, IFN-ɣ, and TNF-ɑ. The data have been depicted in groups (as box-plots) and individually (as lines in order to show intra-individual changes). The cells exposed to recombinant sIFNAR2 were compared to the positive control (c+) (Wilcoxon Rank test). N = 20 * p< 0.01. (D) Cell viability before the fixation and permeabilization of cells for the evaluation of the production of intracellular cytokines by flow cytometry using LIVE/DEAD® Fixable Far Red. N = 20. ns: non-significant.

