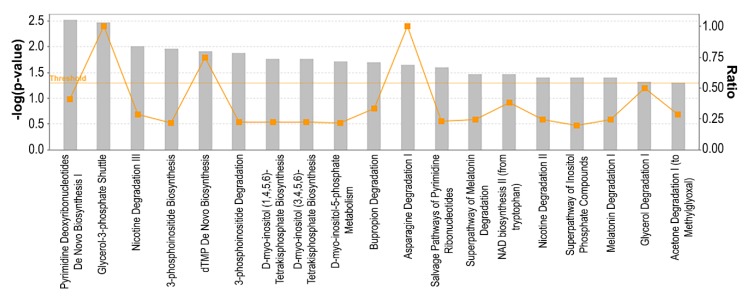
Figure 5.
Metabolic pathway analysis of ER+ palbociclib-resistant breast cancer cells. A higher–log(p-value) shown on the left Y axis represents more significant pathways. The ratio (right Y axis) refers to the number of genes from the dataset that map to the pathway divided by the total number of genes that map the canonical pathway from the IPA database. pval ≤ 0.05; qval ≤ 0.05; |log2FC| ≥ 1.

