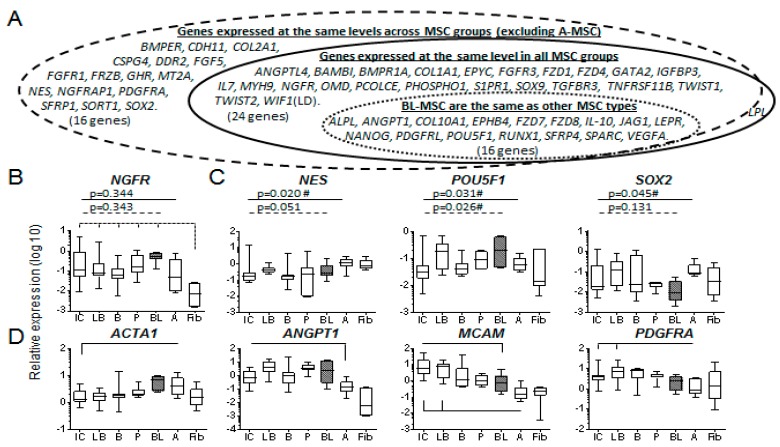
Figure 4.
Evidence of molecular similarity of BL-MSCs to other MSC types. (A) Representation of gene expression similarity between BL-MSCs and other MSC types. Solid line: same across all MSC groups for 24 genes, dashed line: same for an additional 17 genes (but no longer LPL) when adipose-MSCs were excluded, dotted line: post-hoc multivariate analysis showed that gene expression was the same between blood-MSCs and all other MSC types for a further 14 genes. (B) NGFR transcript expression was the same for all MSC types, dashed lines show all MSCs (except adipose-MSCs) distinct from fibroblasts. (C) blood-MSCs expressed markers of immaturity at similar levels (Kruskal–Wallis) to other MSC types, no multivariate differences were found between blood and other MSC types. (D) Pericyte-related markers were expressed at similar levels across MSC types, any multivariate differences are shown (solid line). IC = iliac crest marrow, LB = long bone marrow, B = control bone, P = periosteum, BL = blood, A = adipose, Fib = fibroblast.

