Figure 3.
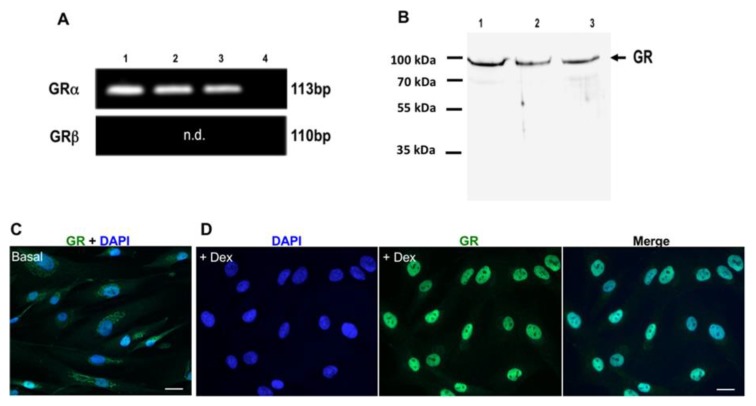
Expression of GR in human testicular peritubular cells (HTPCs). (A) Representative RT-PCR products from HTPCs of three different donors (1–3). A single band at the expected size of 113 bp is depicted, which upon sequencing was found to correspond to human GRα. Negative control (4) including RNA instead of cDNA shows no band. GRβ is not detected (n.d.) by RT-PCR. (B) Western blot of GR was performed with 10 µg of total protein extracted from three different HTPC patient lines (1–3), which reveal a band at 95 kDa. The membrane was stripped and re-probed for GAPDH (37 kDa) as loading control (not shown). (C) HTPCs grown in DMEM medium were fixed after 1 h, and the localization of GR was analyzed by immunofluorescence (Basal). Nuclear DNA was stained with DAPI. Under basal conditions, the GR is mainly localized in the cytoplasm, whereas the nuclei are nearly devoid of GR. (D) After Dex treatment (1 µM) for 1 h, GR is identified primarily in the nuclei, indicating translocation of GR after treatment. Scale bars = 10 µm.

