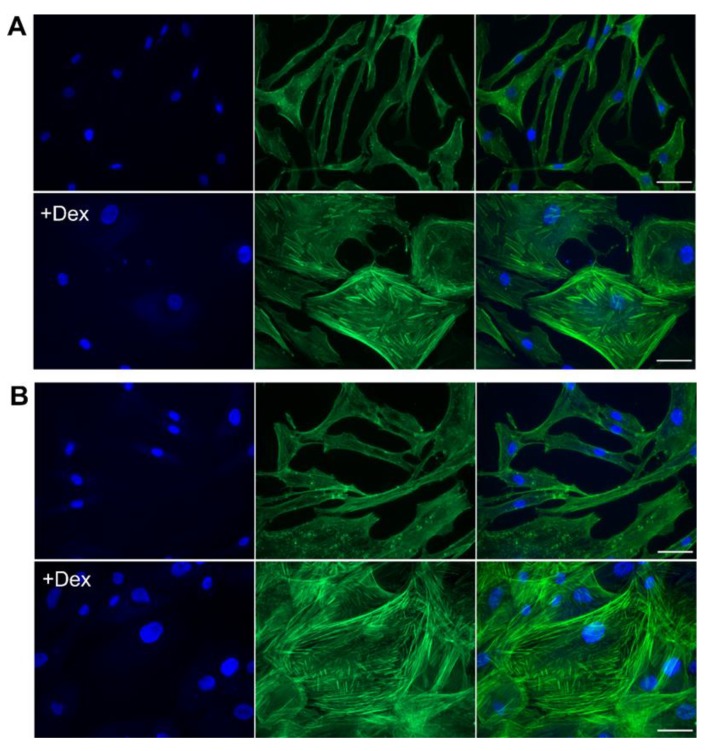
Figure 5.
Dex treatment induces an increase in actin stress fibers and a change in cell morphology. (A,B) Fluorescence microscopy of control HTPCs and cells treated with 1 µM Dex after 24 (A) and 72 h (B). Upper panels show untreated HTPCs; lower panels Dex-treated HTPCs. Filamentous actin was visualized by staining with Atto 488-phalloidin (middle), and DNA with DAPI (left). Merged images are shown on the right. Scale bars = 50 µm.

